
JANUARY 2026
Q4 Investment Commentary
Diversified Global Investors Were Rewarded in Q4 and 2025
Diversified global investors were rewarded in Q4 and throughout 2025. The year witnessed a significant shift where foreign equities outperformed domestic markets, precious metals outperformed equities, and the U.S. dollar weakened against foreign currencies.
In the U.S., the S&P 500 Index rose 2.66% in Q4 and 17.88% for the year. Foreign equity markets displayed even stronger performance, as the MSCI ACWI ex USA Index gained 5.05% in the quarter and surged 32.39% in 2025. Bonds also delivered solid returns as the Bloomberg U.S. Aggregate Bond Index returned 1.10% for the quarter and 7.30% for the full year.1
One of the most surprising and strongest-performing asset classes was precious metals. The Bloomberg Gold Subindex rallied 12.22% in the quarter and 62.46% for the year. Silver outperformed gold as the Bloomberg Silver Subindex rallied 50.96% in Q4 for a significant 138.63% return in 2025.1
Speculative momentum in 2025 at least partially drove significant asset appreciation across artificial intelligence and precious metals, and through risk-taking in unprofitable companies. Investors may need to exercise greater selectivity in 2026 as this speculative froth could fade and require a renewed focus on fundamentals.
The investment landscape for 2026 continues to be defined by resilience and the Fed’s monetary transition. We have moved from an era of combating high inflation with Fed tightening to a period of moderate inflation and normalized interest rates. This shift is supported by an underlying economy that remains fundamentally strong. Financial markets could continue to reward investors if the strong economic environment can persist throughout the new year.
U.S. Economic Strength Continues
The U.S. economy continues to show strength as the initial Q3 Real GDP growth estimate measured 4.3%. Key drivers included resilient consumer activity, exports and government spending. While business investment in artificial intelligence provided a major boost, private investment in manufacturing and wholesale trade lagged. A decline in imports further benefited the strong GDP number for Q3.2
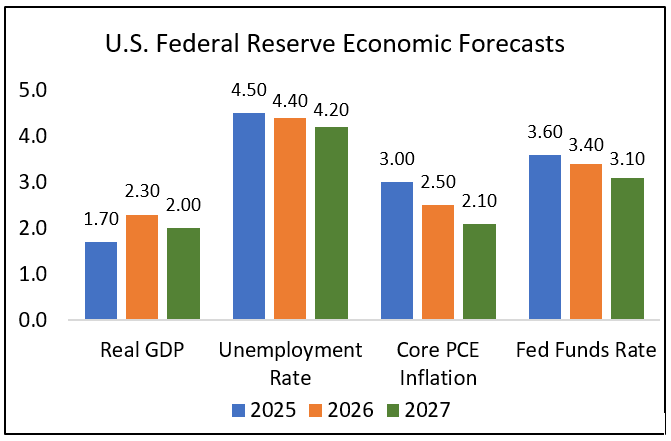
Source: Federal Reserve. Median Forecasts as of 12/20/25.3
The recent rally in financial markets can also have a meaningful wealth effect by strengthening household balance sheets. This primarily benefits middle- and upper-income households that hold financial assets. As net worth expands, these consumers feel empowered to sustain discretionary spending regardless of volatility in other economic sectors. This wealth-supported consumption can act as a stabilizer for the broader economy and support corporate earnings.
Resilient economic growth and controlled inflation could provide a constructive backdrop for financial markets in 2026. If economic growth results in inflation above the Federal Reserve’s 2% long-term target, the Fed could keep the fed funds rate higher for longer. We did not see a sustained downtrend in inflation throughout 2025. Inflation has remained within the 2.5%-3.5% range, which has been persistently above the Fed’s 2% target.
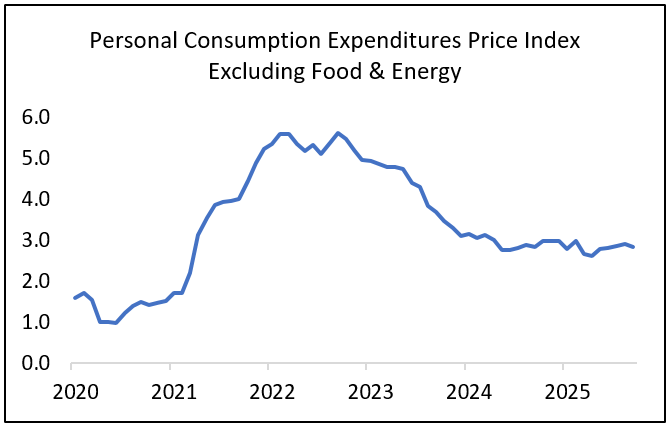
Source: Source: U.S. Bureau of Economic Analysis. FRED. Sep 2025.4
Although economic growth is anticipated to persist, the Federal Reserve forecasts diminishing inflation pressures throughout 2026 and 2027. If the data aligns with these projections, the Fed could resume cutting interest rates at some point in 2026.
Corporate Earnings Growth to Remain Solid
Global corporate earnings growth is anticipated to remain strong in 2026. In the U.S., FactSet consensus estimates project S&P 500 Index earnings per share growth of 14.3% in 2026. This is an acceleration compared to the 11.5% growth estimated for 2025.5
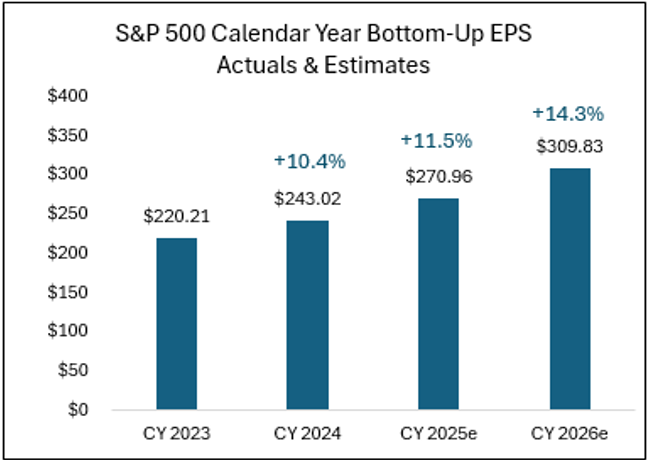
Source: FactSet5
Middle- and upper-income households continue to demonstrate financial resilience. This stability is critical because consumption comprises nearly 70% of U.S. GDP. Elevated concerns remain due to a softening labor market and sticky inflation that could pressure the finances and confidence of lower-income households in the near term.
Business spending on artificial intelligence infrastructure remains strong. This secular AI theme could be just beginning. Investor focus may soon rotate from AI capital spending toward identifying tangible productivity gains and earnings growth for businesses effectively deploying these powerful tools.
As significant capital chases AI-centric themes, equity valuations in this space may be extended in the short term. Concrete productivity and earnings evidence will be needed for investors to maintain their confidence rather than just relying on speculation and hype.
Policy Uncertainty and Political Risks
In Q4, the U.S. government endured a 43-day shutdown, which marks the longest in history. Although this did not materially damage the economy or the financial markets, partisan conflict has not abated and remains a key risk factor for 2026.
The One Big Beautiful Bill Act passed in 2025 was designed to stimulate economic activity through tax cuts and accelerated business investment incentives. This legislation could be a powerful tailwind for consumers and businesses that supports durable economic expansion and strong corporate earnings growth.
Washington’s failure to renew Affordable Care Act health insurance premium subsidies may trigger a sharp rise in premiums that effectively reduces disposable income for millions of households. This surge in added expenses could act as a drag on discretionary spending power. If these subsidies are not extended or legislation is not passed to curb insurance premium costs, softer consumer spending could negatively weigh on the economy, corporate earnings, and ultimately the financial markets.
Trade tariffs remain a complex factor for investors to navigate in 2026. The Supreme Court is expected to rule on whether President Trump’s tariffs are legal as currently implemented. If they are revoked, market volatility could pick up again. The White House may need to restructure the tariffs under different statutes and adjust accordingly. This persistent trade unpredictability could force companies to remain cautious with business planning and might delay economic activity.
The November midterm elections will likely dominate financial headlines in 2026. Markets historically exhibit volatility in the months leading up to the vote due to heightened policy uncertainty. Investors often view divided government favorably because legislative gridlock prevents drastic changes that disrupt business conditions. Current political projections suggest Democrats may gain a majority in the House of Representatives while the Republicans retain the Senate. This political shift could trigger market volatility if investors begin pricing in a less favorable corporate environment should Republicans lose the majority leadership in Congress.
Monetary Policy: The Fed and the Yield Curve
As was widely anticipated, the Federal Reserve lowered the fed funds rate target range by 25 basis points (0.25%) to 3.50%-3.75% in December. This marked a total reduction of 75 basis points in the fed funds rate for the year, following similar reductions in September and October.
Fed policymakers signaled that rate cuts might be on hold for now as economic growth appears durable and inflation is projected to moderate further. Financial markets are pricing in between one and three additional rate cuts in 2026. This suggests that while the easing cycle has continued, the Fed will likely proceed with caution from here.
The Fed will continue monitoring the labor market for signs of material weakness. The U.S. job market remains in a “low hire, low fire” environment. The U.S. unemployment rate of 4.4% measured in December remains at the lower end of its long-term historical range.
Fiscal debt concerns remain a persistent headwind for the economy. Federal leverage is high and accelerating, representing a structural issue that markets cannot ignore indefinitely. The Department of Government Efficiency (DOGE), established in early 2025 with a mandate to reduce federal spending and improve operational efficiency, no longer appears to be a priority for President Trump’s administration. The U.S. government’s debt is a long-term anchor that could drag on growth if bond vigilantes demand significantly higher yields. If U.S. debt levels continue to expand, interest rates along the yield curve may fail to reach sustainably lower levels from here.
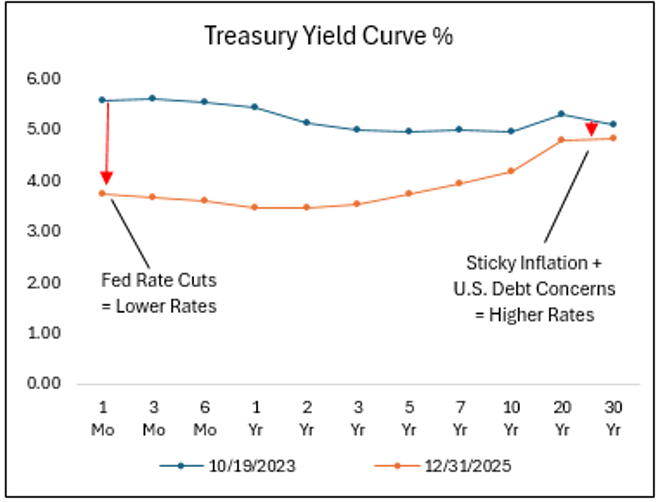
Source: U.S. Department of the Treasury6
Q4 Market Review
Equity Markets
Global equity markets finished strong in the fourth quarter. International equity markets continued their year-long trend of outperforming the U.S. market in 2025.
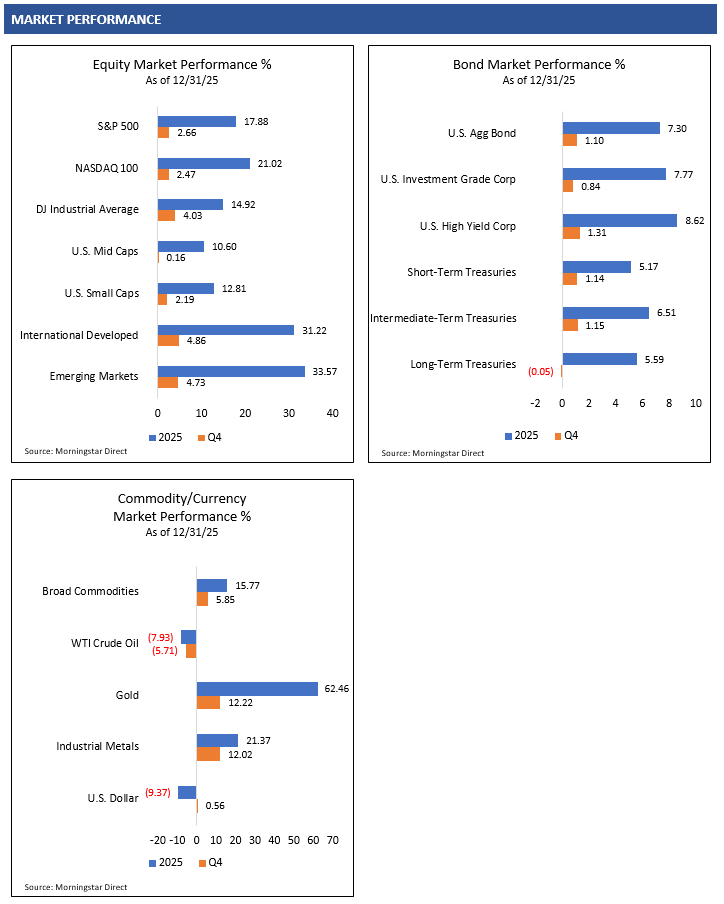
The S&P 500 Index gained 2.66% and the tech-heavy NASDAQ 100 rose 2.47% in Q4. While U.S. mid and small caps generally posted positive returns, they lagged larger companies in the quarter. International equity momentum remained strong in Q4 as the MSCI EAFE Index, which measures developed markets’ equity performance, jumped 4.86% and the MSCI Emerging Markets Index rallied 4.73%.1
Global equity investors captured strong rewards in 2025 yet significant price appreciation outpaced actual corporate earnings growth.
This multiple expansion pushed equity valuations higher in the U.S. and internationally. Investors must now carefully weigh the long-term potential for future corporate earnings growth against the near-term risks associated with these now elevated equity valuations.
The 2025 market environment was a bit bifurcated. Strong fundamentals drove outperformance in artificial intelligence-related stocks while mining companies rallied alongside precious metals. There were also significant gains among lower-quality companies. The outperformance of lower-quality companies’ stocks could be a potential warning sign of speculative froth building in the financial markets.
As the chart below illustrates, equity indices focused on higher-quality companies with consistent profitability and healthy balance sheets generally underperformed. High beta stocks, often linked to momentum and speculation, also significantly outperformed throughout 2025. Investors will need to determine if this outperformance in lower-quality companies and high beta stocks can persist or if fundamentals will ultimately dictate returns in the new year.
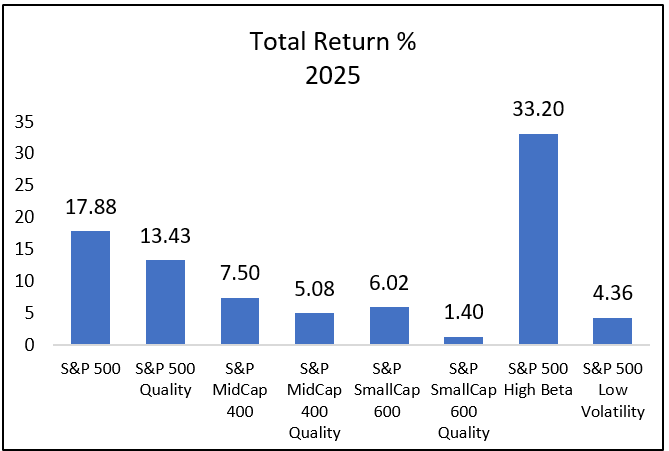
Source: Morningstar Direct. S&P Indices.1
Bond Markets
Fixed income markets provided a steady environment for investors in Q4. Income generation rather than price appreciation served as the primary driver for bond returns in the quarter. The investment-grade Bloomberg U.S. Aggregate Bond Index returned 1.10%, while investors willing to accept higher credit risk saw the Bloomberg High Yield Bond Index gain 1.31% in Q4.
The Federal Reserve lowered the overnight federal funds rate twice in Q4 for a total of 50 basis points (0.50%). The broader bond market had largely priced in these rate cuts already and Treasury yields remained range-bound throughout the rest of the yield curve for the quarter.
The U.S. government shutdown during October and November briefly elevated bond market volatility and credit spreads widened slightly. Sentiment recovered quickly once the political stalemate was resolved and credit spreads compressed back to historically tight valuations.
A resilient economic landscape and solid corporate earnings environment could continue throughout 2026. This constructive backdrop could keep investors supporting credit-sensitive bonds. With tight credit spreads and the Fed potentially getting closer to the end of its interest rate cutting cycle in 2026, bond income generation could serve as the primary driver of total return for the year ahead.
Commodity Markets
Precious metals outperformed many major asset classes throughout 2025. Gold, often viewed as a hedge against inflation, risk assets and a falling U.S. dollar, finished the year up 62.46%. Silver was up 138.63% for the year.
Investors must ask whether this significant price rally across the precious metals was appropriate, assuming they are used for hedging purposes. Global equity markets remained strong as the S&P 500 Index rose 17.88%. Inflation remained stable in the 2.5%-3.5% range and the U.S. dollar declined a moderate -9.37%. Investors will need to consider if the 62% rally in gold was fundamentally justified.
Speculative interest and momentum trading may have fueled a portion of the significant rally in precious metals. If this strong technical momentum fades or reverses direction, investors should be prepared.
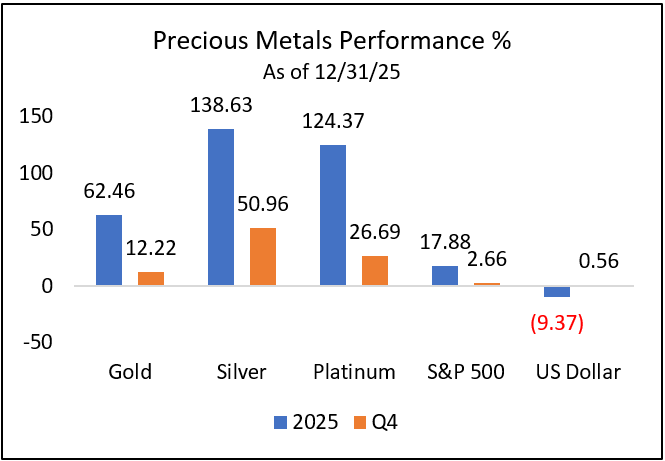
Source: Morningstar Direct. Bloomberg Commodity Subindices.1
WTI Crude Oil has remained in a sustained downtrend over the last few years and trades near the $55-$60 range as OPEC+ and U.S. oil supply outpace demand. Prices remain suppressed and could force higher-cost producers to cut output to preserve margins.
The U.S. government recently captured Venezuelan President Nicolás Maduro and announced plans to revitalize the country’s oil industry using American energy companies. This could create a potential influx of oil supply that may further pressure prices, but this rebuilding would take time.
As the global economy continues to expand, investors will need to monitor global oil supply and demand dynamics, including any potential impact from U.S. involvement in Venezuela.
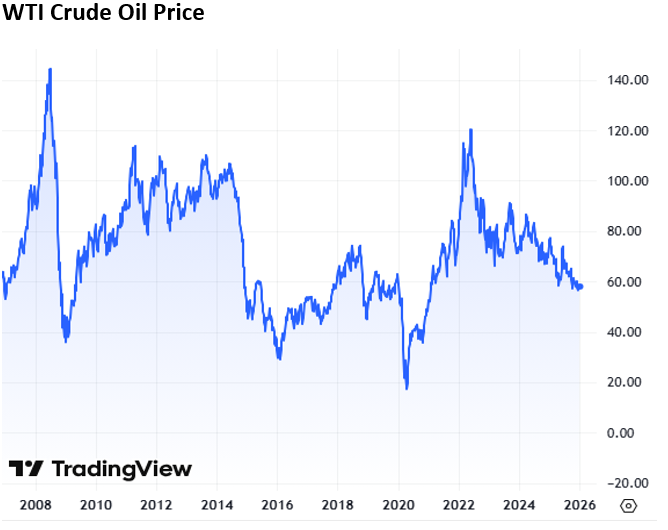
Source: TradingView.com. Weekly data as of 1/6/26.7
Currency Markets
After a brief rally coinciding with the risk-off sentiment surrounding the U.S. government shutdown period in Q4, the dollar has fallen back toward the lower end of its 2025 range. The U.S. Dollar Index declined -9.37% for the full year 2025.1
There has been somewhat of a global bond yield shift as the yield advantage of U.S. Treasuries has declined relative to bonds in Europe and specifically Japan, where yields have reached multi-decade highs. Foreign investors may now have less incentive to chase U.S. yields and could increasingly keep their capital in their own domestic markets.
This global bond yield dynamic could put additional pressure on the U.S. dollar as capital flows to the U.S. may not be as aggressive as they had been in the past. The dollar is still anticipated to remain a “safe haven” currency, but it might need a spike in financial market volatility to reverse materially higher from current levels.
Market Performance
INTRUA MANAGED STRATEGIES
DYNAMIC STRATEGY
The Dynamic strategies represent diversified, multi-asset portfolios that deviate from conventional ‘asset allocation’ methodology. The Dynamic strategy is optimized on a quarterly basis utilizing an ‘Expected Tail Loss’ methodology. This method isn’t solely focused on returns; rather, it seeks to achieve the most consistent, risk-adjusted performance within the investment universe available, characterized by its dynamic and adaptive approach. Utilizing advanced quantitative analysis and a risk overlay system, the Dynamic strategies aim to deliver consistent risk-adjusted returns tailored to investors’ unique risk tolerances and objectives.
Performance Review
The Dynamic strategies exhibited strong results in Q4, with the conservative and moderate models outperforming the most aggressive model. This outcome was driven primarily by differences in exposure to gold and health care, both of which carried higher weights in the lower risk tolerances.
Health care caught a year-end rally as investors rotated into the sector following a prolonged period of underperformance, with valuations having become particularly depressed relative to the broader market. Gold was also a key contributor, continuing its strong advance amid a range of structural tailwinds that have supported the metal throughout much of 2025, including a pivot toward monetary accommodation and continued easing in financial conditions.
Together, these exposures favored portfolios with more defensive positioning and contributed to tighter performance dispersion across risk levels during the quarter.
Positioning
Dynamic Conservative: Increased exposure to technology (XLK), financials (XLF), and short-term cash (SHY), while reducing industrials (XLI), long duration (TLT), core bonds (FIXD), and LC equity (LCSIX).
Dynamic Moderately Conservative: Reduced consumer discretionary (XLY) and health care (XLV), increased utilities (XLU), financials (XLF), real assets (RLY), gold (GLD), and intermediate bonds (FIXD).
Dynamic Moderate: Increased health care (XLV) and financials (XLF) while reducing consumer sectors (XLY, XLP), real assets (RLY), and LC equity (LCSIX); modest increase to mid-term bonds (FIXD).
Dynamic Moderately Aggressive: Rotated toward utilities (XLU), financials (XLF), small/mid equities (MDY, SPLG) while trimming cyclicals (XLY, XLP, XLB) and health care (XLV).
Dynamic Aggressive: Increased exposure to consumer discretionary (XLY), technology (XLK), materials (XLB), broad equities (SPLG, MDY), and gold (GLD) while sharply reducing financials (XLF) and industrials (XLI).
FLEXTREND STRATEGY
The FlexTrend strategies are structured to attempt to participate in the upside of persistent positive-trending U.S. equity and credit markets and to protect value in persistent negative-trending markets. The strategies can significantly reduce risk and raise cash and/or conservative fixed income exposure in large market drawdowns. The strategies are partially allocated to non-trend, defensively managed equity and fundamentally oriented fixed income strategies to attempt to provide further diversification. The portfolios may underperform in trendless or choppy market environments. The FlexTrend strategies utilize mutual funds and ETFs to construct the strategies.
Performance Review
The FlexTrend strategies advanced in Q4 as U.S. equity and bond markets rallied. The strongest performance was from our passive exposure to the S&P 500 Index. Our exposure to hedged equity and valuation-sensitive managers also performed well but trailed the market cap-weighted S&P 500 Index. The FlexTrend strategies’ allocations to quality growth, quality dividend growth, trend-following, and low-volatility hedged strategies were positive for the quarter but lagged the other positions. As the S&P 500 Index remained in a solid, intermediate-term bullish trend throughout Q4, our tactical equity allocation remained bullish for the entire quarter, which also benefited the FlexTrend strategies.
Across the FlexTrend bond allocations, our exposures to tactical, credit-sensitive bond managers were beneficial as credit generally outperformed. Our dedicated exposure to a more conservative short-term bond manager created a slight drag on performance, as the strategy underperformed the tactical, credit-sensitive bond managers in Q4.
Positioning
The FlexTrend strategies focus on seeking growth while actively managing risk. The strategies’ core U.S. equity exposure balances efficient, low-cost indexing with exposure to higher-quality growth companies to capture long-term appreciation potential. The strategies are also allocated across tactical managers that are structured to manage market volatility. Our exposure to hedging strategies remains diversified across option-based hedged equity, trend-following, and valuation-sensitive managers. We also manage a dedicated portion of the equity allocation dynamically based on technical factors. Since medium-term price momentum for U.S. large-cap stocks remains bullish, our tactical allocation remains fully invested to try to capitalize on the prevailing market trend.
The FlexTrend strategies allocate across active bond managers for diversified exposure to bonds. We prefer bond managers who have the flexibility to identify mispriced securities and capitalize on dislocations caused by bond market volatility across sectors and credit quality. The FlexTrend strategies are currently allocated across short- and intermediate-term bond managers to help manage interest rate sensitivity.
FOCUSED INCOME PORTFOLIOS
The Focused Income strategies primarily invest in higher income-generating assets. This can include dividend-paying stocks, option-income strategies, investment-grade bonds, high-yield bonds, emerging markets debt and real estate securities. The strategies’ risk exposure is not tactically managed, which can result in poor performance in weak U.S. market environments. The Focused Income strategies utilize mutual funds and ETFs to construct the strategies.
Performance Review
The Focused Income strategies were positive in Q4 as global equity, multi-asset income strategies and bond markets rallied. The strongest performance came from our exposure to option income and international dividend growth managers. Exposures to U.S. quality dividend growth, multi-asset income and closed-end funds were also additive. The Focused Income strategies’ allocations to mid-cap dividend and global real estate income managers detracted from performance.
Across the Focused Income bond allocations, our overweight to credit-sensitive bond managers contributed positively as credit markets rallied. The strongest performance was from our exposures to tactical bond managers. Our dedicated exposure to an investment-grade, intermediate-term bond manager was additive but underperformed the more credit-sensitive managers.
For our Focused Income – Ultra-Conservative strategy, the structured exposure to short-term bond managers weighed slightly on performance, though our exposure to tactical, credit-sensitive bond managers was a strong contributor. The strategy’s structural lack of equity exposure was a detractor relative to more diversified conservative strategies, as equity markets performed well in the quarter.
Positioning
The Focused Income strategies are constructed to generate higher income through a diversified, multi-asset approach. We also structure the strategies to capture long-term capital appreciation potential. To achieve this balance, we look beyond standard fixed income and allocate across global dividend growth companies and other higher-yielding investments, including global real estate securities, closed-end funds, and option income-based strategies. This approach allows us to layer multiple sources of income, reducing the reliance on any single sector while maintaining exposure to fundamental growth.
Within the Conservative Assets allocation of the Focused Income strategies, we prioritize income generation by maintaining an overweight allocation to credit-sensitive bonds. The strategies are allocated to short- and intermediate-term active bond managers that have the experience and flexibility to actively adjust credit exposure as market conditions provide opportunities.
PRESERVE & PARTICIPATE PORTFOLIOS
The Preserve & Participate strategies take a modern, risk-first approach to portfolio construction. Instead of traditional asset allocation, the strategy uses Q Methodology™ to optimize portfolios based on historical drawdown targets and risk-adjusted return potential. By combining equities, fixed income, and commodities through low-cost ETFs, the models aim to maximize return for each unit of risk taken—aligning with each investor’s unique risk profile.
Performance Review
The Preserve & Participate strategies experienced positive performance across risk levels throughout Q4, with the moderate allocations delivering the strongest results. Similar to the Dynamic portfolios, this outcome was driven primarily by differences in exposure to gold, which proved to be a meaningful contributor during the period.
Gold continued to perform well amid the same structural tailwinds that have supported the metal throughout much of 2025. In addition, the P&P models that outperformed during the quarter maintained exposure to health care, while those that lagged did not, contributing to dispersion across risk levels.
Overall, performance reflected the influence of diversification and sector allocation rather than a linear relationship between risk level and returns, underscoring how factor leadership can shape outcomes within the P&P framework.
Positioning
P&P 5: Increased short-term Treasuries (SHY, SCHO) and consumer staples (XLP) while reducing core bonds (BND) and gold (GLD), with a modest increase to money market.
P&P 10: Reduced short-term Treasuries (SHY, SCHO) and consumer staples (XLP) while increasing core bonds (BND), gold (GLD, PHYS), and health care (XLV).
P&P 20: Reduced long-duration Treasuries (TLT), gold (GLD, PHYS), consumer discretionary (XLY), and health care (XLV) while increasing core bonds (BND), technology (XLK), communication services (XLC), and industrials (XLI).
P&P 30: Increased duration (TLT), technology (XLK), communication services (XLC), utilities (XLU), and health care (XLV) while reducing gold (GLD, PHYS), industrials (XLI), and consumer staples (XLP).
P&P 45: Increased gold (GLD), technology (XLK), communication services (XLC), and consumer discretionary (XLY) while reducing physical gold (PHYS) and health care (XLV).
P&P 60: Reduced gold (GLD) and industrials (XLI) while increasing health care (XLV), consumer discretionary (XLY), and small-cap exposure (IJR).
TOTAL RETURN/TOTAL RETURN ETF PORTFOLIOS
The Total Return and Total Return ETF strategies provide long-term diversified exposure across U.S. and international equities, bonds and income-generating assets. The strategies are structured to participate in the upside of bullish equity and credit markets and provide moderate income generation. The strategies’ risk exposure is not tactically managed and can result in poor performance in weak market environments. The Total Return strategies utilize mutual funds and ETFs to construct the portfolios, while the Total Return ETF strategies only utilize ETFs to construct the strategies.
Performance Review
The Total Return strategies generated positive performance in Q4 as global equities, multi-asset income strategies and bonds rallied. The strongest equity performance came from exposure to value-oriented managers, international quality large cap, international small cap, and emerging markets. Global core and growth active equity managers also performed well. U.S. quality growth and quality dividend growth managers contributed positively, while dedicated U.S. mid-cap equity exposure lagged. Multi-asset income and closed-end fund strategies were additive but generally lagged core U.S. and international large cap, market cap-weighted equity indices.
In the Total Return taxable bond allocation, our exposure to tactical, credit-sensitive bond managers added value as credit markets generally outperformed. Exposure to investment-grade, intermediate-term bond managers also contributed positively but underperformed the tactical, credit-sensitive managers. In the Total Return Muni strategies’ bond allocation, performance among active muni managers was mixed. Relative results were largely driven by duration positioning, as interest rate-sensitive munis generally outperformed for the quarter.
Positioning
The Total Return strategies are constructed for both capital appreciation and income through diversification. The strategies’ equity exposure remains allocated across U.S. and foreign markets and diversified across market cap and investment styles. This can help prevent the Total Return strategies from being overly reliant on any single factor for growth. To generate additional income, the strategies maintain exposure to tactical, multi-asset income and closed-end fund strategies.
The Total Return strategies utilize a diversified approach to bond investing that relies heavily on active bond managers. We allocate a portion of the allocation to bond managers focused on high-quality, investment-grade debt to provide core bond exposure. We also allocate to more flexible, tactical bond managers that can tactically adjust risk exposure across bond sectors and credit quality as market conditions develop. We believe this blend of core exposure and flexibility gives the Total Return strategies an opportunity to successfully manage through various bond market environments.
U.S. CORE/U.S. CORE ETF PORTFOLIOS
The U.S. Core and U.S. Core ETF strategies provide long-term exposure to core U.S. equity and bond markets. The strategies may have some exposure to non-core markets, including foreign assets and lower-quality fixed income. The strategies are structured to participate in the upside of bullish U.S. equity and credit markets. The strategies’ risk exposure is not tactically managed and can result in poor performance in weak U.S. market environments. The U.S. Core strategies utilize mutual funds and ETFs to construct the strategies, while the U.S. Core ETF strategies only utilize ETFs to construct the portfolios.
Performance Review
The U.S. Core strategies advanced in Q4 as U.S. equity and bond markets rallied. The strongest performance was from our exposure to a value-oriented equity manager, followed by passive exposure to the S&P 500 Index. Allocations to large cap quality growth and quality dividend growth companies were also additive. Exposure to mid- and small cap managers lagged, as higher-quality, core mid- and small caps generally underperformed large cap stocks in the quarter.
In the U.S. Core strategies’ taxable bond allocation, exposure to active bond managers was additive. The strongest performance was from our positions in tactical, credit-sensitive bond managers. Our exposure to core, investment-grade bond managers was also a positive, but they lagged the more tactical managers. In the U.S. Core Muni strategies’ bond allocations, performance was mixed as active muni bond managers with longer duration generally outperformed, while managers underweight duration underperformed.
Positioning
The U.S. Core strategies provide broad U.S. equity exposure through a mix of traditional market cap-weighted and factor-based indices, along with actively managed strategies. We emphasize diversification across various investment styles (growth, core, value) and market cap, maintaining a bias toward higher-quality companies that have solid balance sheets with sustainable growth potential.
The U.S. Core strategies maintain a diversified bond allocation across various sectors, credit qualities, and maturities. We continue to favor actively managed core and tactical bond managers for the portfolios. We believe these bond managers possess the depth of resources and experience necessary to successfully navigate the complexities of the evolving bond market.
US CORE X STRATEGY
The U.S. Core X strategy provides long-term exposure to core U.S. equity and bond markets. The strategies may have some exposure to non-core markets, including foreign assets and lower-quality fixed income. The strategies are structured to participate in the upside of bullish U.S. equity and credit markets. The strategy is tactical in nature, allowing for the use of leveraged investments to attempt to generate higher returns. The use of leveraged investments can increase the risk of the strategy. Leveraged investments should be considered speculative investments and may not be suitable for all investors.
Performance Review
The U.S. Core X strategy gained in Q4 as U.S. equities rallied. The strongest performance in the quarter was from leveraged exposure to the Dow Jones Industrial Average Index, followed by exposure to a value-oriented equity manager and leveraged exposure to the S&P 500 Index. Other positive contributors included exposure to U.S. quality growth, U.S. quality dividend growth, passive non-leveraged exposure to the S&P 500 Index, and leveraged exposure to mid- and small-cap equities. Detractors to performance included exposure to mid-cap growth and small-cap quality equities.
Positioning
The U.S. Core X strategy maintained an overweight leveraged exposure to mid-caps as the target index had not hit the price target to reduce risk in Q4. Mid-caps did reach the price target in early January 2026, which resulted in reducing leveraged exposure to mid-caps back to the long-term neutral allocation. Leveraged exposure is now at the neutral target allocation across large-, mid-, and small-cap positions.
Non-leveraged exposure remains allocated across passive exposure to the S&P 500 Index, fundamentally weighted equity indices and actively managed strategies to remain diversified across market cap and investment styles (growth, core, value) for broad U.S. equity exposure.
CONCENTRATED GROWTH SMA PORTFOLIOS
The Concentrated Growth SMA is a focused portfolio of ~40 U.S. large- and mid-cap stocks selected for high returns on invested
capital (ROIC), strong profitability, and reinvestment potential. Using a systematic, quarterly ranking process and a cyclically adjusted
ROE screen, the strategy targets companies with scalable business models and long-term growth prospects. Direct security
ownership helps minimize fees and improve long-term outcomes.
Performance Review
The Concentrated Growth SMA delivered an underwhelming result during Q4, as growth-oriented equities broadly lagged more blended and value-oriented areas of the market. While several holdings posted solid absolute returns, overall performance was weighed down by weakness across a number of growth and consumer-oriented positions.
Positive contributions were led by Cardinal Health (CAH), Bristol-Myers Squibb (BMY), Coca-Cola Consolidated (COKE), FICO, and Mettler-Toledo (MTD), with additional support from Apple (AAPL) and McKesson (MCK).
However, these gains were more than offset by meaningful drawdowns in several holdings, including Netflix (NFLX) and Trex (TREX), alongside weakness in O’Reilly Automotive (ORLY), ADP, Neurocrine (NEU), Manhattan Associates (MANH), and Builders FirstSource (BLDR). This dispersion reflected broader market dynamics, as investors favored more defensive and value-leaning exposures during the period.
Overall, the quarter highlighted the challenges faced by concentrated growth strategies amid shifting market leadership, resulting in performance that trailed more diversified and value-oriented approaches.
Positioning
AAPL, ABBV, ADP, AMP, AN, BCO, BKNG, BLDR, BMY, CAH, COKE, COR, CSL, DECK, DKS, DPZ, EXP, FDS, FICO, FTNT, JBL, LECO, LII, MA, MANH, MCK, MTD, NEU, NFLX, NTAP, NVDA, OMC, ORLY, OTIS, QLYS, SCI, TREX, TXRH, WSM, YUM
MOAT SMA PORTFOLIOS
The MOAT SMA invests in U.S. large-cap companies with durable competitive advantages, or “economic moats,” such as brand strength, cost efficiency, or regulatory barriers. Leveraging Morningstar’s moat ratings and fundamental valuation methods, the strategy seeks to build a risk-aware, long-term growth portfolio focused on capital preservation and consistent outperformance relative to broad market indices.
Performance Review
The MOAT SMA delivered exceptional performance during Q4, driven primarily by strong individual stock selection. Teradyne (TER) was the standout contributor, accounting for nearly a full percentage point of total portfolio performance, reflecting a substantial advance during the period.
Performance was further supported by meaningful contributions from Applied Materials (AMAT), Alphabet (GOOGL), Estée Lauder (EL), Huntington Ingalls (HII), and United Parcel Service (UPS). Strength across semiconductors, industrials, and health care also contributed positively, with additional gains from Lam Research (LRCX), Caterpillar (CAT), Danaher (DHR), Merck (MRK), and Thermo Fisher (TMO).
While several positions detracted during the quarter — most notably Oracle (ORCL) and Veeva (VEEV) — the breadth and magnitude of positive contributors more than offset these headwinds. Overall, the quarter highlighted the effectiveness of the MOAT strategy’s bottom-up, quality-focused approach, with stock-specific performance driving strong absolute results.
Positioning
A, ADBE, ADSK, ALLE, AMAT, AMGN, AMZN, BA, BFB, BMY, CAT, CDNS, CLX, CPB, CRM, CTVA, DHR, DIS, EL, GEHC, GOOGL, HII, HSY, IEX, IFF, KVUE, LRCX, MANH, MAS, MCHP, MDLZ, MKTX, MPWR, MRK, MSFT, NDSN, NKE, NOC, NXPI, ORCL, PEP, PFE, SCHW, SNPS, STZ, TER, TMO, TRU, UPS, USB, VEEV, WDAY, WST, ZBH
QUALITY DIVIDEND SMA PORTFOLIOS
The Quality Dividend SMA targets financially strong U.S. large-cap companies with a history of stable and growing dividends. Rather
than chasing high yields, the strategy emphasizes balance sheet strength, earnings consistency, and dividend coverage, selecting
the top dividend growers in each sector. This results in a diversified, lower-volatility portfolio built for income and long-term growth.
Performance Review
The Quality Dividend SMA underperformed during Q4, particularly in the context of a broader unwind in momentum and rotation toward value and quality-oriented areas of the market. While this environment would typically be supportive for the strategy, performance was pressured by weakness across several holdings.
Positive contributions came from Ralph Lauren (RL), Cisco (CSCO), Morgan Stanley (MS), Johnson & Johnson (JNJ), and U.S. Bancorp (USB), alongside support from energy exposure such as Exxon Mobil (XOM) and select consumer names including TJX and PepsiCo (PEP).
Detractors were concentrated across defensive and industrial-oriented positions, with Kimberly-Clark (KMB) the largest drag on performance. Additional pressure came from IPG, Linde (LIN), Best Buy (BBY), and Air Products (APD), as well as weakness across select real estate and utility-related exposures.
Overall, the quarter highlighted a disconnect between factor expectations and realized outcomes, resulting in underperformance despite a market backdrop that broadly favored value and quality-oriented equities.
Positioning
ADM, APD, ATO, AVB, AWK, BBY, CMCSA, CSCO, CVX, EOG, EXR, JNJ, KMB, LIN, LMT, MDT, MS, OMC, PEP, PFE, PPG, QCOM, REG, RF, RL, SNA, SRE, SWK, TJX, TXN, USB, XOM
IPG
SOURCES
1. Morningstar Direct. Performance provided as total returns. U.S. Mid Caps is defined by the Russell Mid Cap TR USD index. U.S. Small Caps is defined by the Russell 2000 TR USD index. U.S. Growth is defined by the Russell 3000 Growth TR USD index. U.S. Value is defined by the Russell 3000 Value TR USD index. International Developed is defined by the MSCI EAFE NR USD index. Emerging Markets is defined by the MSCI Emerging Markets NR USD index. U.S. Agg Bond is defined by the Bloomberg U.S. Aggregate Bond TR USD index. U.S. Investment Grade Corp is defined by the Bloomberg U.S. Corporate Investment Grade TR USD Index. U.S. High Yield is defined by the Bloomberg High Yield Corporate TR USD index. Broad Commodities is defined by the Bloomberg Commodity TR USD index. WTI Crude Oil is defined by the Bloomberg Sub WTI Crude Oil TR USD Index. Gold is defined by the Bloomberg Sub Gold TR USD Index. Industrial Metals is defined by the Bloomberg Sub Industrial Metals TR USD Index. Short-Term Treasuries defined by the Bloomberg 1-3 Yr U.S. Treasury TR USD index. Intermediate-Term Treasuries defined by the Bloomberg Intermediate U.S. Treasury TR USD Index. Long-Term Treasuries defined by the Bloomberg Long-Term U.S. Treasury TR USD Index.
2. U.S. Bureau of Economic Analysis. Gross Domestic Product, 3rd Quarter 2025 (Initial Estimate) and Corporate Profits (Preliminary). 12/23/25. Retrieved from https://www.bea.gov/news/2025/gross-domestic-product-3rd-quarter-2025-initial-estimate-and-corporate-profits
3. U.S. Federal Reserve. Federal Open Market Committee Economic Projections. 12/10/25. Retrieved from https://www.federalreserve.gov/monetarypolicy/fomcprojtabl20251210.htm#xt1p1f4
4. U.S. Bureau of Economic Analysis, Personal Consumption Expenditures Excluding Food and Energy (Chain-Type Price Index) [PCEPILFE], retrieved from FRED, Federal Reserve Bank of St. Louis; https://fred.stlouisfed.org/series/PCEPILFE, January 6, 2026.
5. FactSet. Earnings Insight. 12/19/25.
6. U.S. Department of the Treasury. Daily Treasury Rates. Retrieved from home.treasury.gov.
7. TradingView.com. WTI Crude Oil. Retrieved from https://www.tradingview.com/chart/S5oI8Odc/?symbol=TVC%3AUSOIL 1/6/26.
IMPORTANT DISCLOSURES
The opinions voiced in this material are for general information only and are not intended to provide or be construed as providing specific investment advice or recommendations for any individual security.
Any economic forecasts set forth in the presentation may not develop as predicted and there can be no guarantee that strategies promoted will be successful.
The term “portfolios” used in this piece is in reference to the Intrua Financial model portfolios. Any reference to performance is based on estimated, unaudited, gross of fee performance of the model portfolios. Model portfolio performance is calculated through Morningstar Direct based on model portfolio holdings. Client accounts assigned a Intrua Financial model portfolio may have positioning and performance that differs from the firm’s model portfolios at any given time.
There is no assurance that the techniques and strategies discussed are suitable for all investors or will yield positive outcomes. The purchase of certain securities may be required to affect some of the strategies. Investing in stocks includes numerous specific risks including: the fluctuation of dividend, loss of principal and potential illiquidity of the investment in a falling market.
Bonds are subject to market and interest rate risk if sold prior to maturity. Bond and bond mutual fund values and yields will decline as interest rates rise and bonds are subject to availability and change in price. Government bonds and Treasury bills are guaranteed by the U.S. government as to the timely payment of principal and interest and, if held to maturity, offer a fixed rate of return and fixed principal value. However, the value of fund shares is not guaranteed and will fluctuate.
Investing in stock includes numerous specific risks including: the fluctuation of dividend, loss of principal, and potential illiquidity of the investment in a falling market.
Asset management does not ensure a profit or protect against loss. There is no guarantee that a diversified portfolio will enhance overall returns or outperform a non-diversified portfolio. Diversification does not protect against market risk.
The fast price swings in commodities will result in significant volatility in an investor’s holdings. Commodities include increased risks, such as political, economic, and currency instability, and may not be suitable for all investors.
Precious metal investing involves greater fluctuation and the potential for losses.
Alternative investments may not be suitable for all investors and should be considered as an investment for the risk capital portion of the investor’s portfolio. The strategies employed in the management of alternative investments may accelerate the velocity of potential losses.
International investing involves special risks such as currency fluctuation and political instability and may not be suitable for all investors. These risks are often heightened for investments in emerging markets.
Securities offered through LPL Financial. Member FINRA/SIPC. Investment advice offered through Intrua Financial, LLC, a registered investment advisor and separate entity from LPL Financial.
This research material has been prepared by Intrua Financial, LLC.