

JULY 2026
Q2 Investment Commentary
Equities and Bonds Rally, Oil Declines in Q2
In the second quarter, global equity and credit markets rebounded from first-quarter weakness as the U.S.-Iran conflict transitioned into a series of intermittent ceasefires and ongoing attempts at de-escalation. President Trump’s initial ceasefire announcement on April 7 sparked a risk-on environment that persisted throughout the quarter.
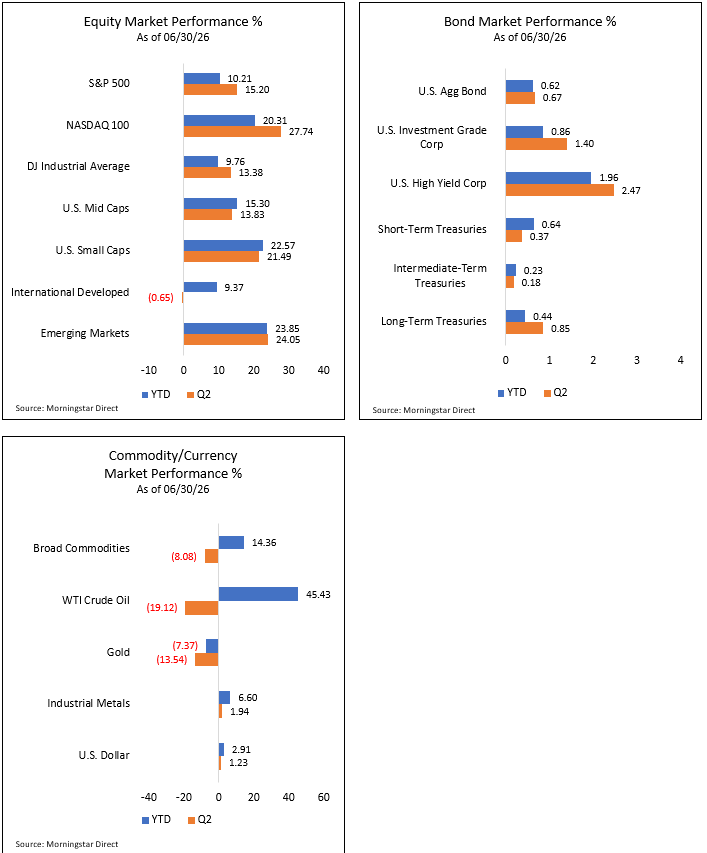
In Q2, the S&P 500 Index rallied 15.20%, while the technology-heavy NASDAQ 100 Index posted a 27.74% gain. 1 Investors continued to show their appetite for investments related to artificial intelligence, propelling AI-related stocks significantly higher in the quarter.
With the potential for de-escalation in the Middle East, energy prices have declined significantly from their recent peaks as the worst fears of supply disruption have eased. West Texas Intermediate crude oil fell from a high of approximately $120 per barrel in early March to below $70 per barrel in late June, but the situation remains fragile.
This steep drop in energy prices served as a catalyst for the broader financial markets. Cheaper oil can directly translate to lower transportation and input costs for businesses while providing relief to consumers at the gas pump. This easing of lingering inflationary pressures helped push interest rates lower from their highs and added to the bullishness in equities. For the time being, investors may remain focused on the underlying strength of the global economy and corporate fundamentals.
Economic Stability but Inflation Pressures Persist
From a fundamental perspective, a resilient U.S. economy paired with strong corporate earnings growth continues to support bullish momentum in equities. According to FactSet, analysts project over 20% year-over-year earnings growth for the S&P 500 Index this year and continued growth into 2027.2
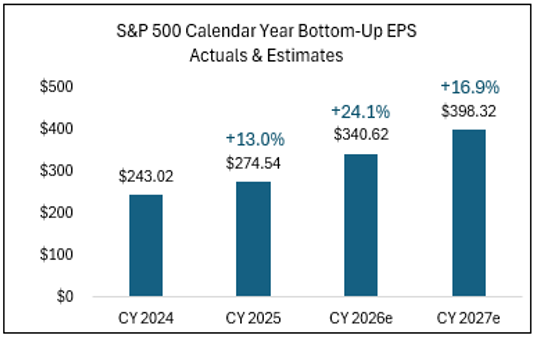
Source: FactSet.2
Recent macroeconomic data shows resilience in the U.S. economy. Based on the June 2026 Purchasing Managers’ Index reports from the Institute for Supply Management, both the U.S. manufacturing and services sectors remain in expansion territory, with readings of 53.3 and 54.0, respectively. A PMI reading above 50 indicates economic growth. A stable economy could provide a solid foundation for corporate fundamentals, and investors could continue to support equity and credit markets accordingly.
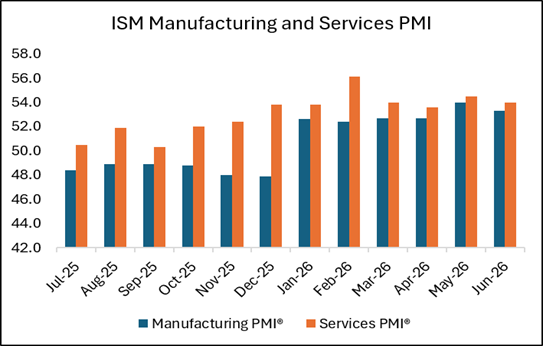
Source: Institute for Supply Management 4,5
The U.S. economy and labor market are anticipated to remain supportive, but inflation is currently hovering above the Federal Reserve’s long-term target of 2%. The recent spike in energy prices, combined with heavy capital expenditures and demand tied to the artificial intelligence infrastructure buildout, suggests that inflationary pressures could stay for longer than anticipated. This may lead the Federal Reserve to maintain a tighter monetary policy for longer.
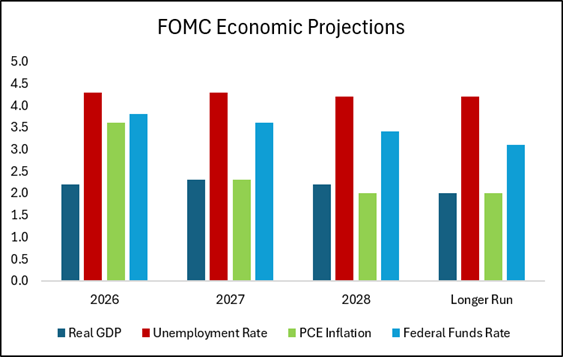
New Fed Chairman and a Hawkish Tilt
Recent commentary from new Federal Reserve Chairman Kevin Warsh and other Fed governors indicates a potentially hawkish tilt and a desire to manage monetary policy to keep inflation in check. This leaves the door open for a potential rate hike rather than the series of rate cuts that market participants widely anticipated at the beginning of the year.
Chairman Warsh appears to favor a communication style that provides fewer explicit insights and less forward guidance than what investors grew accustomed to under his predecessor, Jerome Powell. By reducing this transparency, Chairman Warsh may be introducing an environment where market participants need to rely more on raw data rather than explicit central bank guidance. This structural shift in communication could result in higher uncertainty and more volatility in the bond markets.
Inflation has remained stubbornly sticky. The Personal Consumption Expenditures (PCE) price index excluding food and energy (Core PCE), serves as a key inflation metric for the Federal Reserve because it strips out volatile energy and food components to reveal long-term pricing trends. The May 2026 Core PCE Index reading showed an increase of 3.4% year-over-year, continuing an upward trend over the last few months. The broader Consumer Price Index for May, which does include food and energy costs, jumped to 4.2% on a year-over-year basis. Both measures remain above the preferred 2% long-term inflation target set by the Federal Reserve.
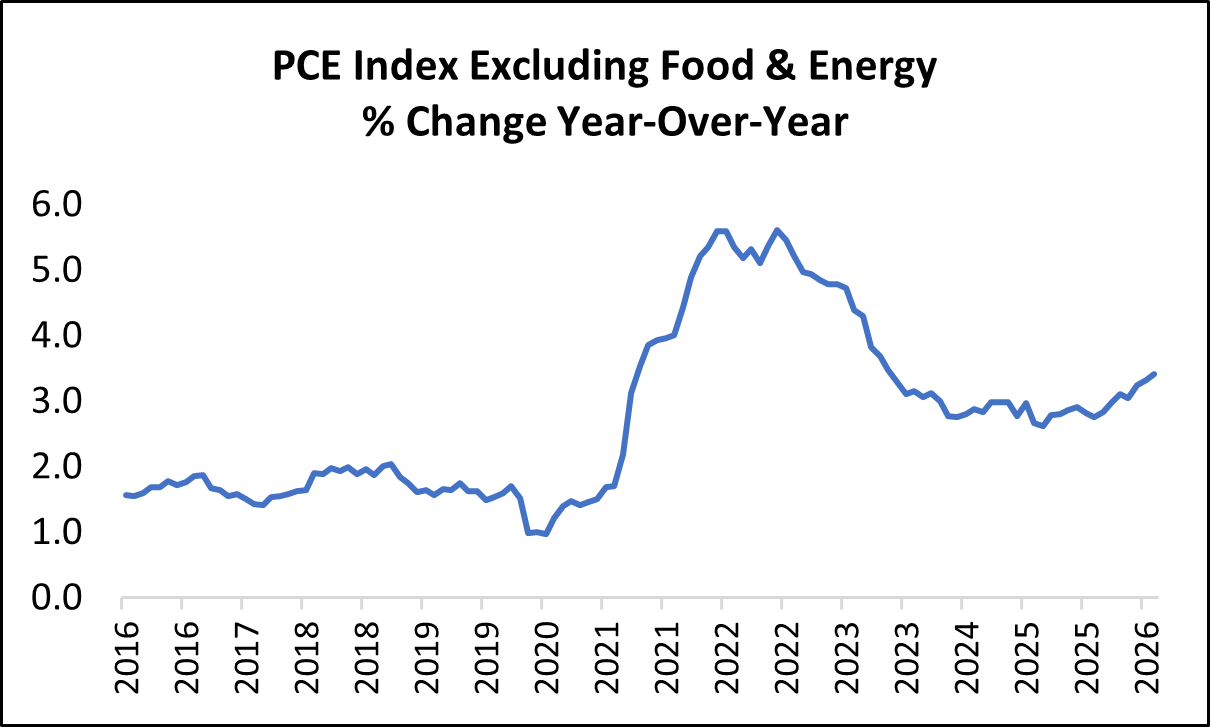
Source: U.S. Bureau of Economic Analysis. FRED.6
This persistent pricing pressure may ultimately force the Federal Reserve to either maintain the current federal funds rate target range of 3.50% to 3.75% or implement an additional rate hike to reduce inflation pressures. As it currently stands, the federal funds futures market is pricing in at least one rate hike before the end of the year. This is a significant reversal from the market narrative in early April, when investors were still pricing in a Fed rate cut.
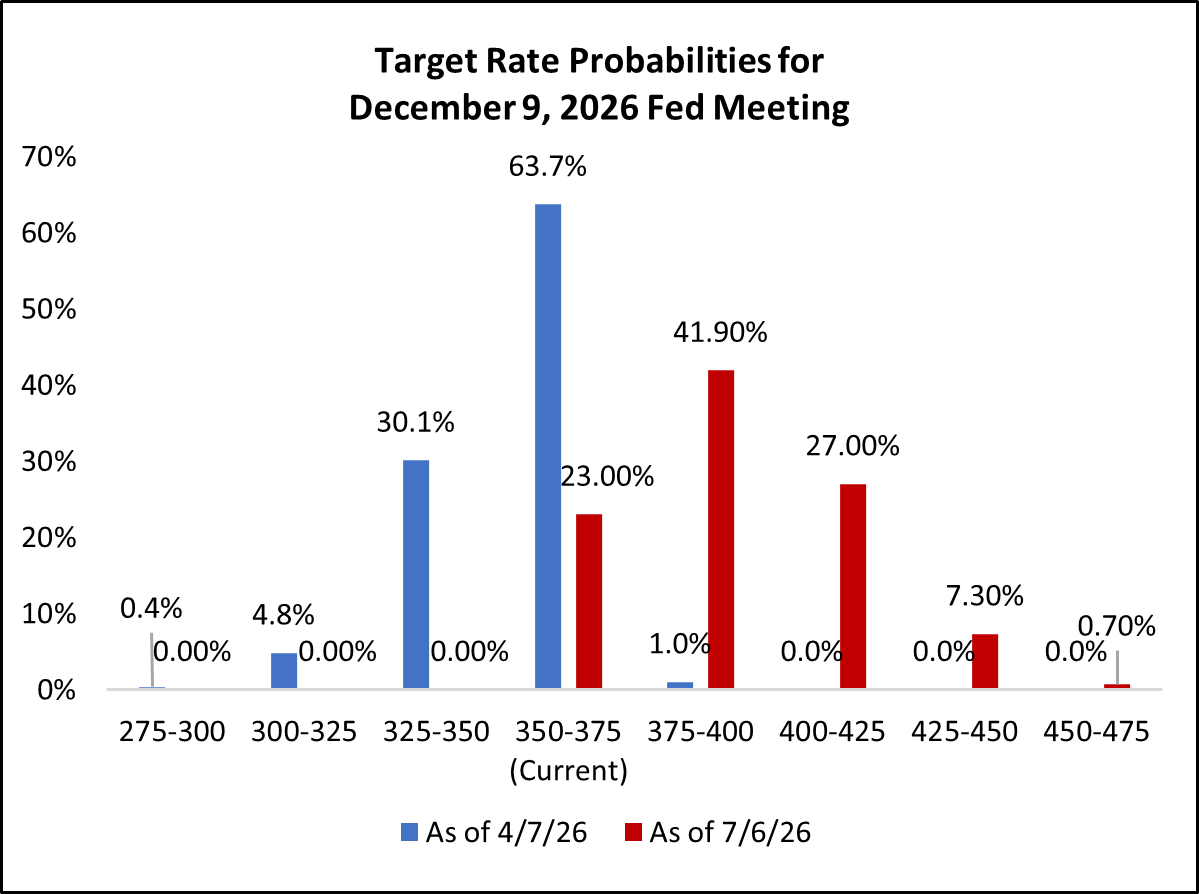
Source: CME Group7
Looking Ahead to the Second Half
It has been a strong start to the year for equity and bond investors, but macroeconomic uncertainties remain. The U.S.-Iran conflict has not been fully resolved. Questions regarding the return on investment for artificial intelligence initiatives are being raised. A potentially less transparent Federal Reserve under new Chairman Kevin Warsh and the upcoming U.S. midterm elections are key political factors investors will need to navigate.
If economic and corporate strength persists and investors can look past these short-term market uncertainties, they could continue to be rewarded as we move through the second half of the year.
Q2 Market Review
Equity Markets
Following the equity market weakness in Q1 from the U.S.-Iran conflict, U.S. equity markets rallied in Q2 as investors were optimistic that the U.S.-Iran conflict could be contained.
The S&P 500 Index rebounded 15.20% and the NASDAQ 100 Index rallied 27.74% in Q2. Investors continued to aggressively support AI infrastructure-related companies in semiconductors, memory and networking businesses, pushing these companies’ stock prices significantly higher. Small cap stocks, which can have higher sensitivity to the U.S. economy and are often favored by momentum traders, performed very well in Q2, with the Russell 2000 Index up 21.41% in the quarter.
YTD Performance (as of 6/30/26)
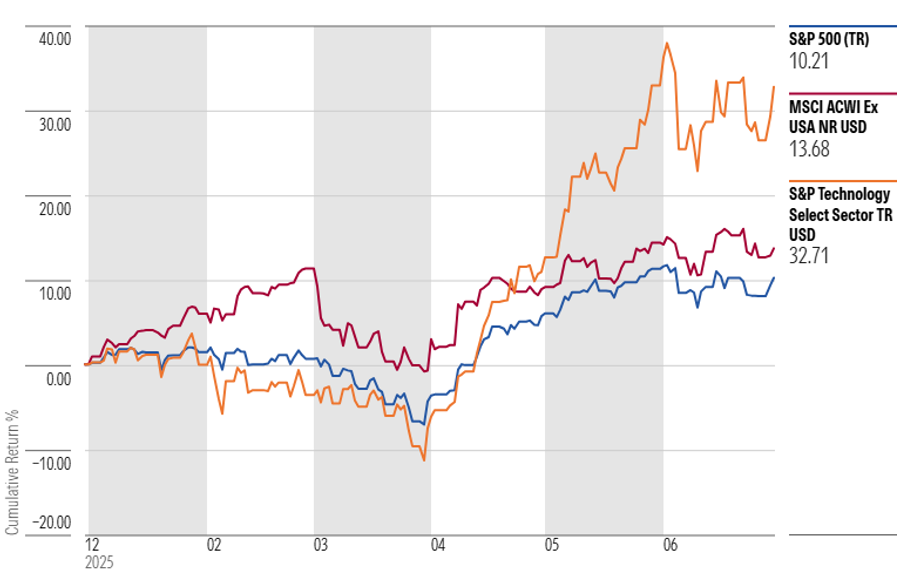
Source: Morningstar Direct1
High-momentum and high-beta stocks significantly outperformed in Q2. It remains to be seen whether this speculative and momentum-driven market environment will persist, or if parts of the equity market have overshot their fundamental potential over the short term.
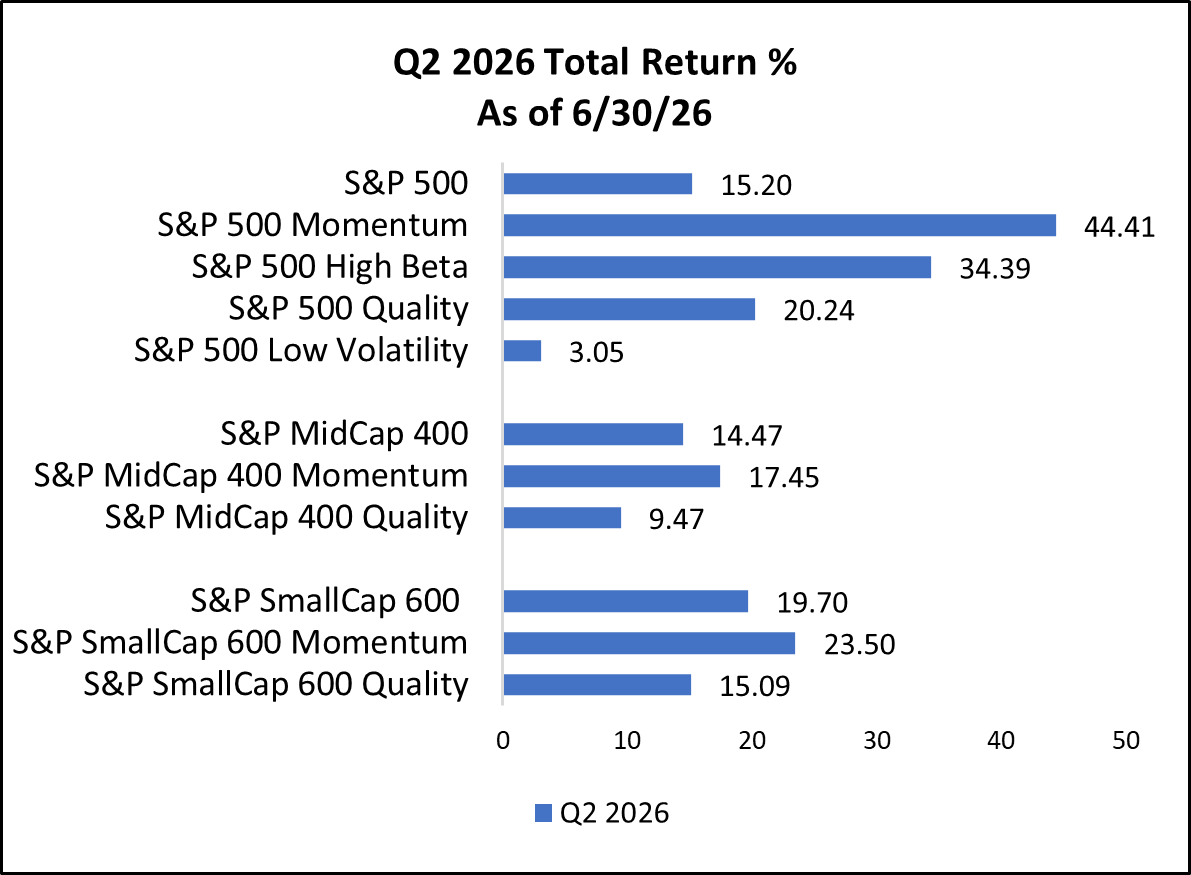
Source: S&P Indices. Morningstar Direct1
International markets were mixed in Q2. The MSCI EAFE Index, measuring foreign developed equity markets, was slightly negative at -0.65% in the quarter. The MSCI Emerging Markets Index, which has quickly become concentrated in AI-related semiconductor and memory companies in Asia, rallied 24.05% in the quarter.1
Global economic and corporate fundamentals still appear solid. Equity valuations remain elevated relative to history, but strong underlying earnings growth has kept price-to-earnings multiples from eclipsing recent highs. This setup may be enough for investors to continue to support global equities to higher levels.
Bond Markets
U.S. bonds delivered generally positive results in the second quarter. Treasury yields were volatile and shifted slightly higher throughout the quarter as inflation remained stubbornly persistent. This caused investors to start considering the potential for the Federal Reserve to raise the federal funds rate, which resulted in the Treasury yield curve shifting higher.
During the second quarter, the U.S. 10-year Treasury yield reached a high of roughly 4.67% before ending the quarter at 4.44%. The longer-term 30-year Treasury yield closed the quarter at 4.91%.8 Although rising interest rates initially pressured bond valuations during the quarter, bond income generation helped to protect total return.
At the start of Q2, credit spreads had widened due to rising geopolitical tensions between the U.S. and Iran. As investors started to believe that the conflict could be somewhat contained, demand for riskier corporate debt increased, and credit spreads tightened. A resilient macroeconomic environment and solid corporate earnings growth also provided a strong fundamental backdrop for underlying corporate credit markets.
Looking at broader bond market performance, the investment-grade-focused Bloomberg U.S. Aggregate Bond Index returned 0.67% in Q2. The more credit-sensitive and volatile Bloomberg High-Yield Bond Index returned 2.47%. This high-yield bond performance marked a strong rebound from the credit weakness experienced earlier in the year.
Interest rates have maintained their recent higher levels, and credit spreads remain tight relative to historical averages. For now, bond investors may be positioning for income generation rather than anticipating capital appreciation from falling interest rates and credit spread tightening.
Commodity Markets
The potential easing of geopolitical tensions between the U.S. and Iran has resulted in significant price reversals in both oil and precious metals in Q2.
The unpredictable nature of ongoing negotiations between the U.S. and Iran has created significant volatility within global energy markets. At the beginning of this geopolitical conflict, West Texas Intermediate crude oil prices experienced a price spike from the low $50 per barrel range to roughly $120 per barrel in March. Since then, there has been a series of negotiations and on-again, off-again ceasefires taking place.
Over the last few months, investors have attempted to look past the immediate geopolitical uncertainties. Market participants are increasingly assuming that both the U.S. and Iran ultimately want to reach an agreement to prevent severe oil supply constraints and avoid further price shocks. This shift in market psychology has caused oil to trend significantly lower, falling below $70 per barrel in late June, driven by the belief that oil supplies will come back online in the near future.
While questions remain regarding the ultimate resolution of the U.S.-Iran conflict and whether full oil production can be sustained to meet global demand, investors will need to keep a close eye on declining oil storage levels. Investors will need to see if global supply chains can return to their previous capacity and whether balance can return to the global energy markets.
WTI Crude Oil Price
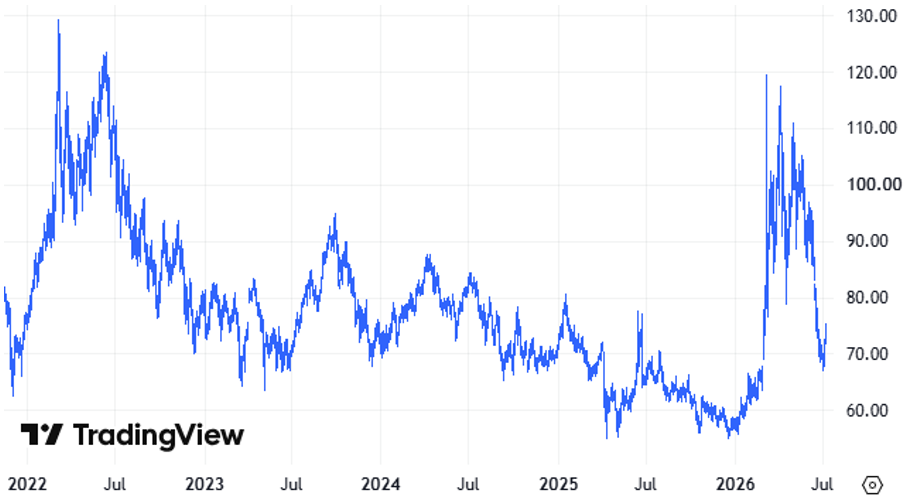
Source: TradingView.com9
In our previous quarterly commentaries, we expressed concern that gold and silver prices may have been trading largely on short-term price momentum and speculation. We suggested that a cautious approach to gold and silver might be warranted.
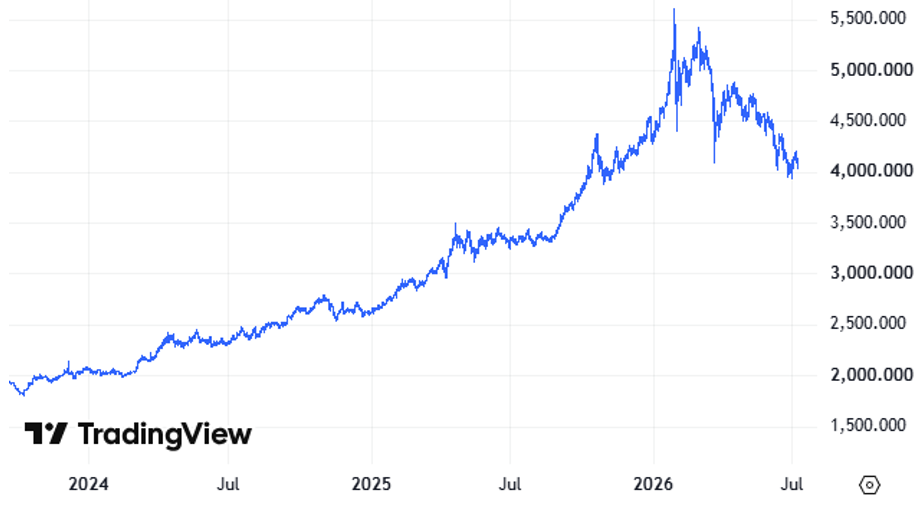
Gold experienced extreme volatility throughout the first and second quarters as the significant upward price momentum from last year eventually faded. From its high of almost $5,600 per ounce reached in late January of this year, gold quickly declined almost 30% as it fell below $4,000 an ounce. It has since bounced from that level. Gold investors will need to be able to navigate what appears to be an increasingly volatile, momentum-driven market environment.
Gold Price
Source: TradingView.com10
Currency Markets
The U.S. dollar has shown some strength this year. The U.S. Dollar Index rallied 1.23% in Q2 and is up 2.91% for the year.1 The U.S. dollar historically acts as a “safe haven” asset during periods of elevated geopolitical uncertainty. The risks tied to the U.S.-Iran conflict may have provided support for the U.S. dollar this year.
The U.S. economy remains fundamentally strong, which can attract foreign capital to U.S. assets, particularly with the added excitement driven by U.S. artificial intelligence-related companies. Sticky inflation in the U.S. has also led bond markets to price in the potential for higher interest rates for longer. This combination of solid economic growth and higher bond yields relative to other developed countries could continue to drive support for the U.S. dollar.
Market Performance
INTRUA MANAGED STRATEGIES
DYNAMIC STRATEGIES
The Dynamic strategies represent diversified, multi-asset portfolios that deviate from conventional ‘asset allocation’ methodology. The Dynamic strategy is optimized on a quarterly basis utilizing an ‘Expected Tail Loss’ methodology. This method isn’t solely focused on returns; rather, it seeks to achieve the most consistent, risk-adjusted performance within the investment universe available, characterized by its dynamic and adaptive approach. Utilizing advanced quantitative analysis and a risk overlay system, the Dynamic strategies aim to deliver consistent risk-adjusted returns tailored to investors’ unique risk tolerances and objectives.
Performance Review
The Dynamic strategies generated positive results in Q2, with the more growth-oriented models leading the group as risk assets rebounded sharply from the volatility experienced late in the first quarter. Investor sentiment improved as the immediate geopolitical risk premium tied to the U.S.-Iran conflict faded, energy prices declined from prior highs, and markets shifted back toward corporate fundamentals, earnings growth, and AI-related investment themes.
The strongest performance drivers came from technology and broad U.S. equity exposure. Q2 leadership was concentrated in the infrastructure layer of the AI ecosystem, including semiconductors, memory, data center equipment, and companies tied to computing demand. This environment benefited the Dynamic models’ technology exposure, while broad S&P 500 exposure, consumer discretionary, small caps, and financials also helped performance as market participation broadened later in the quarter.
The main headwinds came from gold and more defensive exposures. Gold declined during the quarter as geopolitical safe-haven demand faded, and sticky inflation data triggered a hawkish shift in monetary policy—driving bond yields and the U.S. dollar higher, which pressured non-yielding assets. Utilities and other defensive areas also lagged as investors favored higher-beta growth and cyclical assets. Overall, the quarter rewarded the Dynamic models’ equity and technology exposure, while defensive and inflation-sensitive positions were less beneficial in a risk-on environment.
Positioning
Dynamic Conservative: Increased long-duration Treasuries (TLT), short-term Treasuries (SHY), real assets (RLY), gold (GLD), and S&P 500 exposure (SPLG) while reducing large-cap equities (LCSIX), core bonds (FIXD), consumer staples (XLP), and GMSSX.
Dynamic Moderately Conservative: Increased industrials (XLI), S&P 500 exposure (SPLG), large-cap equities (LCSIX), core bonds (FIXD), long-duration Treasuries (TLT), and consumer staples (XLP) while reducing GMSSX, FSMSX, real assets (RLY), short-term Treasuries (SHY), mid-cap equities (MDY), and technology (XLK).
Dynamic Moderate: Increased health care (XLV), consumer discretionary (XLY), large-cap equities (LCSIX), real assets (RLY), and gold (GLD) while reducing industrials (XLI), short-term Treasuries (SHY), S&P 500 exposure (SPLG), and FSMSX.
Dynamic Moderately Aggressive: Increased real assets (RLY), utilities (XLU), and S&P 500 exposure (SPLG) while reducing materials (XLB), small-cap equities (IWM), gold (GLD), and health care (XLV).
Dynamic Aggressive: Increased financials (XLF), materials (XLB), consumer discretionary (XLY), and S&P 500 exposure (SPLG) while reducing industrials (XLI), small-cap equities (IWM), mid-cap equities (MDY), and utilities (XLU).
FLEXTREND STRATEGIES
The FlexTrend strategies seek long-term, risk-managed growth by blending core U.S. equity exposure with diversified exposure across defensively managed equity strategies. These may include trend-, option-, valuation-, volatility-based and other hedged equity strategies. The Investment Committee will also tactically adjust equity exposure based on intermediate-term price trends in the U.S. equity market. Conservative assets are allocated to actively managed bond strategies that can tactically adjust exposures across various market environments. The FlexTrend strategies may underperform in aggressive momentum or trendless, choppy market environments.
Performance Review
The FlexTrend strategies generated positive performance in Q2 as U.S. equity and credit markets rallied. The strongest contributors to performance in the quarter included passive exposure to the S&P 500 Index, U.S. quality growth stocks, U.S. dividend growth stocks and a tactical low-volatility, cash-managed equity strategy. Our exposure to options-based hedged equity strategies was also additive, but these strategies generally lagged the S&P 500 Index in the quarter, as hedged strategies are anticipated to lag in a strong equity market rally. Our allocation to a valuation-sensitive strategy was also positive in the quarter, but it was the weakest equity-related strategy in Q2. The S&P 500 Index maintained its bullish trend throughout Q2, which resulted in our remaining fully invested in our tactical U.S. equity trading position for the duration of the quarter, benefiting performance.
In our FlexTrend strategies’ allocation to bonds, our exposure to active short-term and tactical bond managers was solidly positive in the second quarter. Our allocation to credit-sensitive tactical bond managers was a significant contributor to performance relative to the core bond index in Q2, as credit markets bounced back from weakness in Q1. Positioning in active short-term bond managers was positive, but these managers lagged the tactical bond managers in the quarter.
Positioning
The FlexTrend strategies target long-term, risk-conscious growth by combining core U.S. equity exposure with defensive, tactically managed equity strategies. This allocation incorporates option-, valuation-, and volatility-based hedged equity strategies managed by third-party investment managers. Additionally, we actively manage a portion of the equity portfolio, guided by intermediate-term trend indicators. As the U.S. S&P 500 Index continues to trend higher, our intermediate-term trend signal remains bullish, and we are positioned accordingly.
The FlexTrend strategies allocate to diversified bond exposure by utilizing active managers equipped to navigate the complexities of the bond markets. To help manage interest rate risk, the portfolio is currently diversified across both short- and intermediate-term bond managers. We believe taking an active approach in our bond exposures provides the ability for allocations to shift across duration, sectors and credit qualities as market conditions evolve.
FOCUSED INCOME STRATEGIES
The Focused Income strategies primarily invest in higher income-generating assets. This can include dividend-paying stocks, option-income strategies, investment-grade bonds, high-yield bonds, emerging markets debt and real estate securities. The strategies’ risk exposure is not tactically managed, which can result in poor performance in weak U.S. market environments. The Focused Income strategies utilize mutual funds and ETFs to construct the strategies.
Performance Review
The Focused Income strategies rallied in Q2 as investors supported income-generating assets and credit-sensitive bonds. Within our equity allocation, the strongest contributors to performance included our positions in valuation-sensitive equity option-income, U.S. dividend growth, U.S. mid cap dividend, international dividend growth, closed-end funds and global real estate income strategies. Our positions in tactical multi-asset income and core U.S. large cap option-income strategies were also positive contributors in Q2, but they lagged the other strategies in the quarter.
Within the Focused Income strategies’ bond allocations, our allocation to credit-sensitive bond managers was a key driver of performance in Q2, as credit-sensitive bonds rebounded from the weakness experienced in Q1. Our strongest contributors to performance in Q2 were our exposures to tactical credit-sensitive bond managers. Our positions in a core, investment-grade manager and a short-duration credit-sensitive manager were positive, but they lagged the tactical managers in Q2.
Our Focused Income – Ultra-Conservative strategy also rallied in Q2 as positioning in credit-sensitive, short-term and tactical bond managers generated positive performance. All positions contributed positively in the quarter, but our positions in credit-sensitive, tactical bond managers outperformed our positions in short-term bond managers in Q2.
Positioning
The Focused Income strategies seek to generate current income while pursuing long-term capital appreciation. Portfolio exposure is distributed across a wide range of income-generating assets, including global dividend-paying equities, real estate securities, credit-sensitive bonds, closed-end funds, and option-based strategies. By taking a multi-asset, multi-strategy approach, the portfolio reduces its reliance on any single asset class while attempting to meet its income and growth objectives.
Within the conservative portion of the Focused Income strategies, we prioritize income generation by maintaining an overweight position in credit-sensitive bonds. The Focused Income strategies utilize active short- and intermediate-term bond managers who have the ability to dynamically adjust their risk exposures. This active management approach attempts to generate yield while navigating evolving bond market environments.
PRESERVE & PARTICIPATE STRATEGIES
The Preserve & Participate strategies take a modern, risk-first approach to portfolio construction. Instead of traditional asset allocation, the strategy uses Q Methodology™ to optimize portfolios based on historical drawdown targets and risk-adjusted return potential. By combining equities, fixed income, and commodities through low-cost ETFs, the models aim to maximize return for each unit of risk taken—aligning with each investor’s unique risk profile.
Performance Review
The Preserve & Participate strategies benefited from the sharp Q2 rebound in technology and growth equities, with the higher-risk models leading the group as market sentiment improved. The quarter rewarded equity participation, particularly in areas tied to technology, artificial intelligence infrastructure, and cyclical recovery. This created a favorable backdrop for the more growth-oriented P&P models, which carried higher equity exposure and greater sensitivity to risk assets.
Technology was the dominant positive driver for the higher-risk models. P&P 45 and P&P 60 had meaningful exposure to the Technology Select Sector SPDR ETF (XLK), which was a powerful tailwind as investors rotated back into AI-related and semiconductor-linked leadership. Consumer discretionary, industrials, health care, and small-cap exposure also contributed positively across parts of the model set as the broader equity rally extended beyond technology alone.
The largest headwind was gold. Gold and physical gold exposure detracted as the safe-haven and geopolitical risk premiums from Q1 faded, while sticky inflation data forced a sharp market repricing toward higher interest rates and a more hawkish Federal Reserve stance, raising the opportunity cost of holding non-yielding assets. Communication services also detracted in the higher-risk models. Overall, the model set performed in line with its design: higher-risk portfolios captured more of the equity rally, while more conservative models were less exposed to the strongest-performing areas of the market.
Positioning
P&P 5: Increased core bonds (BND) and gold (GLD) while reducing money market exposure and health care (XLV).
P&P 10: Increased core bonds (BND) and consumer staples (XLP) while reducing short-term Treasuries (SHY, SCHO), health care (XLV), small-cap growth (IWO), long-term Treasuries (TLT), and utilities (XLU).
P&P 20: Increased core bonds (BND), technology (XLK), and short-term Treasuries (SHY) while reducing consumer staples (XLP), utilities (XLU), and health care (XLV).
P&P 30: Increased consumer discretionary (XLY), short-term Treasuries (SHY), technology (XLK), long-term bonds (BLV), and long-duration Treasuries (TLT) while reducing health care (XLV), physical gold (PHYS), and consumer staples (XLP).
P&P 45: Increased consumer discretionary (XLY) and small-cap equities (IJR) while reducing industrials (XLI).
P&P 60: Increased industrials (XLI) and health care (XLV) while reducing consumer discretionary (XLY), physical gold (PHYS), real estate (VNQ), and small-cap equities (IJR).
TOTAL RETURN/TOTAL RETURN ETF STRATEGIES
The Total Return and Total Return ETF strategies provide long-term diversified exposure across U.S. and international equities, bonds and income-generating assets. The strategies are structured to participate in the upside of bullish equity and credit markets and provide moderate income generation. The strategies’ risk exposure is not tactically managed and can result in poor performance in weak market environments. The Total Return strategies utilize mutual funds and ETFs to construct the portfolios, while the Total Return ETF strategies only utilize ETFs to construct the strategies.
Performance Review
The Total Return strategies generated positive performance in Q2 as global equity and bond markets rallied. The strongest contributors to equity performance in Q2 were exposures to diversified emerging markets, U.S. large and mid cap growth, global growth, passive exposure to the S&P 500 Index, and U.S. dividend growth equity strategies. Other positive contributors in the quarter were equity exposures to international small cap and global value strategies, but these areas generally underperformed the other equity exposures in the quarter. Our dedicated allocations to multi-asset income strategies were also beneficial in Q2, but these positions lagged the other pure equity strategies in the quarter.
In the Total Return strategies’ taxable bond allocation, performance was led by exposures to credit-sensitive, tactical bond managers as credit markets rallied in Q2. Our positions in core, investment-grade-focused bond managers were also positive contributors, but these positions lagged the tactical bond managers in the quarter. In the Total Return Muni strategies’ bond allocation, the strongest contributor was our exposure to a tactical, credit-sensitive municipal bond manager. Our positions in core municipal bond managers were also additive, but they trailed the credit-sensitive municipal bond manager in Q2.
Positioning
The Total Return strategies target a mix of capital appreciation and income through global diversification. Equity exposure is spread across both U.S. and international markets, diversified by market capitalization and investment style. To increase income generation, we incorporate allocations to closed-end funds alongside a tactical, multi-asset income manager. We believe this blend of global equity exposure and income generation could help provide some balance across changing market environments.
The Total Return strategies are allocated to active bond managers for diversified exposure across the fixed-income markets. The allocation balances core bond managers with tactical managers capable of dynamically adjusting their risk exposures depending on the market environment. We believe this combined approach gives the Total Return strategies the flexibility needed to navigate short-term uncertainties while maintaining long-term objectives.
In Q2, we replaced an intermediate-term taxable bond manager with another actively managed, core, intermediate-term bond ETF strategy. Also in Q2, within our blended mutual fund/ETF Total Return Muni strategies, we transitioned from an actively managed, core, intermediate-term municipal bond manager to another actively managed, core, intermediate-term municipal bond ETF manager. We believe these manager changes allow the Total Return taxable and municipal bond exposures to be actively managed for potential success over the long term.
U.S. CORE/U.S. CORE ETF STRATEGIES
The U.S. Core and U.S. Core ETF strategies provide long-term exposure to core U.S. equity and bond markets. The strategies may have some exposure to non-core markets, including foreign assets and lower-quality fixed income. The strategies are structured to participate in the upside of bullish U.S. equity and credit markets. The strategies’ risk exposure is not tactically managed and can result in poor performance in weak U.S. market environments. The U.S. Core strategies utilize mutual funds and ETFs to construct the strategies, while the U.S. Core ETF strategies only utilize ETFs to construct the portfolios.
Performance Review
The U.S. Core strategies rallied in Q2 as U.S. equities and bonds generated positive performance. The strongest contributors to performance in Q2 included exposure to mid cap growth (in blended mutual fund/ETF strategies only), passive exposure to the S&P 500 Index, quality small caps, a factor-based value strategy (in ETF-only strategies), and quality large/mid cap growth equity strategies. Other positive contributors included an actively managed value manager (in blended mutual fund/ETF strategies only) and a factor-based mid cap equity strategy (in ETF-only strategies), but these positions lagged the other equity strategies in the quarter.
In the U.S. Core strategies’ taxable bond allocation, our exposures to tactical, credit-sensitive bond managers were significant contributors to performance in the quarter. Our exposures to core, intermediate-term bond managers also added to performance in Q2, but these positions lagged the tactical bond managers. In the U.S. Core Muni strategies’ muni bond allocations, our position in a tactical municipal bond manager was the strongest contributor. Positive contributions also came from our core, intermediate-term municipal bond managers, but they lagged the tactical municipal bond manager in Q2.
Positioning
The U.S. Core strategies provide exposure to U.S. equities by blending traditional market-capitalization and factor-based indices with active strategies from third-party investment managers. The portfolio provides broad diversification across growth, core, and value investment styles, as well as various market capitalizations. We believe a diversified equity approach with a preference for growing, higher-quality companies can act as a strong foundation for long-term investors.
The U.S. Core strategies focus on providing broad U.S. bond exposure across sectors, credit quality, and maturities. We prefer to allocate to active core and tactical bond managers who we believe have the deep experience that is vital for navigating today’s shifting fixed-income markets. We believe taking an active bond management approach has the potential to better navigate through various credit cycles.
In Q2, we replaced an intermediate-term taxable bond manager with another actively managed, core, intermediate-term bond ETF strategy. Also in Q2, within our blended mutual fund/ETF U.S. Core Muni strategies, we transitioned from an actively managed, core, intermediate-term municipal bond manager to another actively managed, core, intermediate-term municipal bond ETF manager. We believe these manager changes allow the U.S. Core taxable and municipal bond exposures to be actively managed for potential success over the long term.
US CORE X STRATEGY
The U.S. Core X strategy provides long-term exposure to core U.S. equity and bond markets. The strategies may have some exposure to non-core markets, including foreign assets and lower-quality fixed income. The strategies are structured to participate in the upside of bullish U.S. equity and credit markets. The strategy is tactical in nature, allowing for the use of leveraged investments to attempt to generate higher returns. The use of leveraged investments can increase the risk of the strategy. Leveraged investments should be considered speculative investments and may not be suitable for all investors.
Performance Review
The U.S. Core X strategy generated positive returns in Q2 as U.S. equities performed well in the quarter. Performance was led by positive contributions from each of the portfolio’s leveraged U.S. equity positions. Additional contributions came from non-leveraged exposures to mid cap growth, passive S&P 500 Index, high-quality large/mid cap growth and high-quality small cap equity managers. Allocations to a large cap quality dividend growth manager and a valuation-sensitive equity manager were also positive contributors in Q2, but these positions lagged the other positions in the quarter.
Positioning
The U.S. Core X strategy seeks to provide diversified exposure to U.S. equities across market cap and investment styles through passive, factor-based and actively managed third-party managers. The strategy is also tactically allocated to leveraged equity strategies, providing leveraged exposure to U.S. large, mid and small cap passive equity indices. No tactical adjustments to leverage were made in Q2. As U.S. equities are near all-time highs, leveraged exposure is currently at a neutral target level. Should U.S. equities decline to predetermined levels, leveraged exposure may be increased at that time. The strategy intends to tactically rebalance positions should allocations fall outside of their target ranges or if volatility provides potential opportunities to do so.
CONCENTRATED GROWTH SMA STRATEGY
The Concentrated Growth SMA is a focused portfolio of ~40 U.S. large- and mid-cap stocks selected for high returns on invested
capital (ROIC), strong profitability, and reinvestment potential. Using a systematic, quarterly ranking process and a cyclically adjusted
ROE screen, the strategy targets companies with scalable business models and long-term growth prospects. Direct security
ownership helps minimize fees and improve long-term outcomes.
Performance Review
The Concentrated Growth SMA delivered strong results in Q2 as the market environment favored high-quality growth companies, AI infrastructure beneficiaries, and businesses tied to technology and data center investment. The strategy participated in the rally through several holdings directly aligned with the quarter’s strongest themes.
Micron was the largest contributor, benefiting from strong investor demand for companies tied to AI-related memory and semiconductor infrastructure. Comfort Systems also contributed meaningfully, reflecting investor enthusiasm for companies connected to data center construction, power infrastructure, and broader industrial demand. Roku, AppLovin, and NVIDIA were also notable contributors, supported by the broader rally in growth stocks, digital platforms, and AI-linked equities.
Detractors were more concentrated in commodity-sensitive and company-specific names. Coeur Mining and Newmont detracted as gold declined during the quarter and precious-metals-related equities came under pressure. APA was negatively affected by the decline in oil prices as energy markets reversed from Q1 highs. McKesson and NRG also detracted, though their weakness was more company-specific relative to the broader growth-led market rally. Overall, the strategy benefited from strong exposure to the market’s dominant Q2 leadership areas, while commodity-linked holdings and select idiosyncratic detractors partially offset results.
Positioning
ADBE, APA, APP, CBOE, CDE, CF, CL, COST, CVNA, EME, EXPD, EXPE, FIX, INCY, LLY, MCO, MEDP, MO, MSCI, MU, NEM, NRG, PEG, PM, PSTG, ROKU, SCCO
AAPL, ABBV, AMP, AN, BCO, BKNG, BLDR, BMY, COKE, CSL, DECK, DKS, EXP, FDS, FTNT, JBL, LECO, LII, MANH, MTD, NEU, NFLX, NTAP, OMC, ORLY, OTIS, QLYS, SCI, TREX, TXRH, WSM, YUM
MOAT SMA STRATEGY
The MOAT SMA invests in U.S. large-cap companies with durable competitive advantages, or “economic moats,” such as brand
strength, cost efficiency, or regulatory barriers. Leveraging Morningstar’s moat ratings and fundamental valuation methods, the
strategy seeks to build a risk-aware, long-term growth portfolio focused on capital preservation and consistent outperformance
relative to broad market indices.
Performance Review
The MOAT SMA generated positive results in Q2, helped by a strong rebound in technology, software, cybersecurity, and semiconductor-related holdings. Datadog, Palo Alto Networks, Fortinet, Applied Materials, and NXP Semiconductors were the largest contributors. These holdings benefited from the broader market rotation back into growth-oriented companies, particularly those tied to AI infrastructure, cybersecurity demand, and semiconductor supply chains.
An important nuance for the quarter is that several of the strongest contributors were later removed in the most recent rebalance. This does not necessarily indicate a negative view of those businesses. Rather, it reflects the strategy’s process discipline. When high-quality companies appreciate sharply and valuation becomes less attractive relative to other opportunities, the MOAT framework can rotate away from prior winners and into companies with more attractive forward-looking risk/reward characteristics.
The primary detractors were Zoetis, MarketAxess, CoStar, Copart, and Broadridge. These companies lagged in a market environment that strongly favored AI infrastructure, semiconductors, and higher-growth technology exposures. Some of the weakness appears tied to company-specific factors, while part of the underperformance reflects the broader market’s preference for higher-beta growth leadership during the quarter. The strategy enters the next quarter with a refreshed portfolio that maintains exposure to high-quality companies with durable competitive advantages, while seeking better valuation support after the sharp Q2 rally.
Positioning
Added
APH, CMG, DIS, DPZ, GWRE, HII, HSY, JKHY, MELI, META, MKC, MSI, NOC, PEP, TSCO
Removed
A, AMAT, AMZN, BX, CSGP, DDOG, ENTG, FTNT, MKTX, NXPI, PANW, TMO, TRU, USB, WST
QUALITY DIVIDEND SMA STRATEGY
The Quality Dividend SMA targets financially strong U.S. large-cap companies with a history of stable and growing dividends. Rather
than chasing high yields, the strategy emphasizes balance sheet strength, earnings consistency, and dividend coverage, selecting
the top dividend growers in each sector. This results in a diversified, lower-volatility portfolio built for income and long-term growth.
Performance Review
The Quality Dividend SMA produced positive results in Q2 during a transition quarter as the strategy moved from the legacy dividend holdings to the updated QD model. The broader market environment favored growth and technology over traditional income-oriented equities, but the strategy still benefited from several legacy dividend holdings with exposure to technology, semiconductors, housing, and cyclical recovery.
The strongest contributors were Qualcomm, Texas Instruments, Cisco, Masco, and PulteGroup. Qualcomm and Texas Instruments benefited from the same semiconductor and AI-adjacent tailwinds that supported the broader technology complex during the quarter. Cisco contributed as technology infrastructure exposure recovered, while Masco and PulteGroup benefited from improving sentiment toward housing and consumer-linked cyclicals. Because several of these contributors were legacy holdings that were later removed as part of the transition, the quarter’s contribution profile should be understood as reflecting both the old and new portfolio exposures.
The primary detractors were New York Times, Zoetis, Lockheed Martin, Morningstar, and Medtronic. Lockheed Martin declined despite the broader defense spending backdrop, as the market’s near-term focus shifted away from defense and geopolitical risk beneficiaries and toward AI, semiconductors, and higher-growth areas. New York Times, Zoetis, Morningstar, and Medtronic detracted due to a combination of company-specific weakness and lower investor appetite for more defensive or non-technology-oriented businesses. The updated QD model enters the next quarter with a refreshed set of quality dividend growers and broader sector exposure.
Positioning
Added
ABT, ALSN, AOS, CF, CHD, CI, CSL, HSY, ITT, LECO, LII, MA, MAS, MCO, MORN, MSI, NEU, NYT, PHM, SEIC, SYK, ZTS
Removed
ADM, APD, ATO, AVB, AWK, BBY, CSCO, CVX, EOG, EXR, IPG, JNJ, KMB, LIN, MDT, MS, OMC, PEP, PFE, QCOM, REG, RF, RL, SNA, SRE, SWK, TJX, TXN, USB, XOM
SOURCES
1. Morningstar Direct. Performance provided as total returns. U.S. Mid Caps is defined by the Russell Mid Cap TR USD index. U.S. Small Caps is defined by the Russell 2000 TR USD index. U.S. Growth is defined by the Russell 3000 Growth TR USD index. U.S. Value is defined by the Russell 3000 Value TR USD index. International Developed is defined by the MSCI EAFE NR USD index. Emerging Markets is defined by the MSCI Emerging Markets NR USD index. U.S. Agg Bond is defined by the Bloomberg U.S. Aggregate Bond TR USD index. U.S. Investment Grade Corp is defined by the Bloomberg U.S. IG Corp USD 300 M TR USD Index. U.S. High Yield is defined by the Bloomberg High Yield Corporate TR USD index. Broad Commodities is defined by the Bloomberg Commodity TR USD index. WTI Crude Oil is defined by the Bloomberg Sub WTI Crude Oil TR USD Index. Gold is defined by the Bloomberg Sub Gold TR USD Index. Industrial Metals is defined by the Bloomberg Sub Industrial Metals TR USD Index. Short-Term Treasuries defined by the Bloomberg 1-3 Yr U.S. Treasury TR USD index. Intermediate-Term Treasuries defined by the Bloomberg Intermediate U.S. Treasury TR USD Index. Long-Term Treasuries defined by the Bloomberg Long-Term U.S. Treasury TR USD Index.
2. FactSet. Earnings Insight. 7/2/26.
3. Federal Open Market Committee. Summary of Economic Projections June 17, 2026 https://www.federalreserve.gov/monetarypolicy/fomcprojtabl20260617.htm
4. Institute for Supply Management. June 2026 ISM® Manufacturing PMI® Report https://www.ismworld.org/supply-management-news-and-reports/reports/ism-pmi-reports/pmi/june/
5. Institute for Supply Management. June 2026 ISM® Services PMI® Report https://www.ismworld.org/supply-management-news-and-reports/reports/ism-pmi-reports/services/june/
6. U.S. Bureau of Economic Analysis, Personal Consumption Expenditures Excluding Food and Energy (Chain-Type Price Index) [PCEPILFE], retrieved from FRED, Federal Reserve Bank of St. Louis; https://fred.stlouisfed.org/series/PCEPILFE, July 6, 2026.U.S. Bureau of Labor Statistics, All Employees, Total Nonfarm [PAYEMS], retrieved from FRED, Federal Reserve Bank of St. Louis; https://fred.stlouisfed.org/series/PAYEMS, April 6, 2026.
7. CME Group. FedWatch Tool. Retrieved 4/8/26 and 7/6/26 from https://www.cmegroup.com/markets/interest-rates/cme-fedwatch-tool.html
8. U.S. Treasury. Daily Treasury Par Yield Curve Rates https://home.treasury.gov/resource-center/data-chart-center/interest-rates/TextView?type=daily_treasury_bill_rates&field_tdr_date_value=2026
9. TradingView.com. WTI Crude Oil. Retrieved 7/8/26 from https://www.tradingview.com/chart/S5oI8Odc/?symbol=TVC%3AUSOIL
10. TradingView.com. Gold. Retrieved 7/8/26 from https://www.tradingview.com/chart/S5oI8Odc/?symbol=TVC%3AGOLD
IMPORTANT DISCLOSURES
The opinions voiced in this material are for general information only and are not intended to provide or be construed as providing specific investment advice or recommendations for any individual security.
Any economic forecasts set forth in the presentation may not develop as predicted and there can be no guarantee that strategies promoted will be successful.
The term “portfolios” used in this piece is in reference to the Intrua Financial model portfolios. Any reference to performance is based on estimated, unaudited, gross of fee performance of the model portfolios. Model portfolio performance is calculated through Morningstar Direct based on model portfolio holdings. Client accounts assigned a Intrua Financial model portfolio may have positioning and performance that differs from the firm’s model portfolios at any given time.
There is no assurance that the techniques and strategies discussed are suitable for all investors or will yield positive outcomes. The purchase of certain securities may be required to affect some of the strategies. Investing in stocks includes numerous specific risks including: the fluctuation of dividend, loss of principal and potential illiquidity of the investment in a falling market.
Bonds are subject to market and interest rate risk if sold prior to maturity. Bond and bond mutual fund values and yields will decline as interest rates rise and bonds are subject to availability and change in price. Government bonds and Treasury bills are guaranteed by the U.S. government as to the timely payment of principal and interest and, if held to maturity, offer a fixed rate of return and fixed principal value. However, the value of fund shares is not guaranteed and will fluctuate.
Investing in stock includes numerous specific risks including: the fluctuation of dividend, loss of principal, and potential illiquidity of the investment in a falling market.
Asset management does not ensure a profit or protect against loss. There is no guarantee that a diversified portfolio will enhance overall returns or outperform a non-diversified portfolio. Diversification does not protect against market risk.
The fast price swings in commodities will result in significant volatility in an investor’s holdings. Commodities include increased risks, such as political, economic, and currency instability, and may not be suitable for all investors.
Precious metal investing involves greater fluctuation and the potential for losses.
Alternative investments may not be suitable for all investors and should be considered as an investment for the risk capital portion of the investor’s portfolio. The strategies employed in the management of alternative investments may accelerate the velocity of potential losses.
International investing involves special risks such as currency fluctuation and political instability and may not be suitable for all investors. These risks are often heightened for investments in emerging markets.
Intrua Financial, LLC (“Intrua”) is an SEC-registered investment adviser. Registration as an investment adviser does not imply a certain level of skill or training.
This research material has been prepared by Intrua Financial, LLC.