
APRIL 2026
Q1 Investment Commentary
Iran Conflict Drives Asset Volatility in Q1
The initial outlook for the year reflected a sense of optimism as investors anticipated moderate U.S. economic growth alongside strong corporate earnings and global stability. This environment resulted in a continued rally in global equities, where cyclical sectors performed well and market participation began to broaden beyond artificial intelligence-related companies and momentum-based speculative trades. That positive narrative faced an abrupt shift in March when the U.S. and Israel began military actions against Iran.
The immediate market reaction followed a classic risk-off pattern driven by a sudden spike in energy costs. Crude oil prices surged, forcing a quick repricing of inflation expectations. This caused interest rates to climb and the U.S. dollar to strengthen, while global stocks and precious metals entered correction territory.
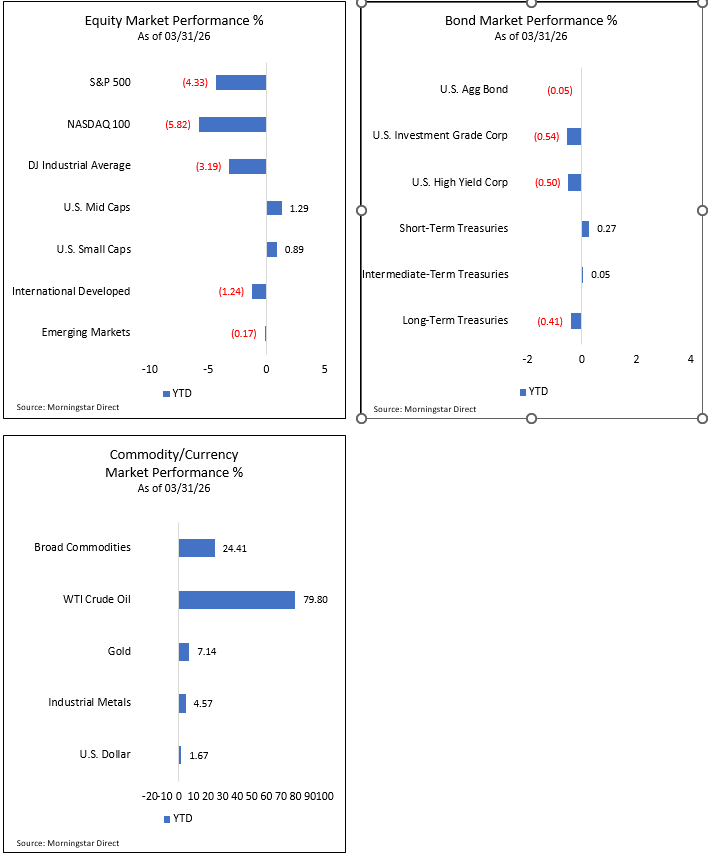
While the quarterly performance figures provide a snapshot of the period, they mask the volatility that occurred in March. For the first quarter, the S&P 500 Index lost 4.3%, while the technology-heavy NASDAQ 100 Index fell 5.8% and the Dow Jones Industrial Average Index saw a 3.2% decrease.1
Bond markets remained somewhat more resilient, as the Barclays US Aggregate Bond Index stayed nearly flat and the Bloomberg High Yield Corporate Bond Index declined only 0.5% for the quarter. WTI Crude Oil finished the quarter with a massive 79.8% gain, which served as a primary headwind for equity performance. Gold managed to end the quarter up 7.1% despite a sharp retracement from its prior high. 1
The Trump administration characterized its military operations in Iran as a targeted effort rather than the start of a prolonged conflict. Following a high-stakes ultimatum issued to Iran, President Trump announced an agreement on April 7 for a two-week ceasefire. This pause is intended to allow the U.S. and Iran to negotiate an end to the conflict. The announcement triggered a decline in oil prices and interest rates, while sparking a broad rally across global equities, bonds and precious metals.
Time will tell whether this ceasefire can translate into longer-term de-escalation and a reduction in geopolitical risk across the Middle East. If so, investors can shift back to focusing on economic and corporate fundamentals.
Economic Headwinds from Geopolitical and Energy Shocks
Until the geopolitical risk in the Middle East subsides, financial markets could continue to struggle with the inflationary pressure of WTI Crude Oil trading over $100 per barrel. This represents a substantial surge from the mid-$50s range where oil was priced prior to the recent conflict in Iran. This massive price spike essentially acts like a tax on consumers and could compress business profit margins. If oil prices remain elevated for an extended period, investors may need to pivot away from the original 2026 narrative of solid global growth and prepare for a potentially weaker macroeconomic environment.
To reduce this potential risk and limit lingering economic damage, U.S. and OPEC+ oil and gas producers must find ways to increase supply, or the conflict will need to reach a quick resolution. Because macroeconomic data is inherently backward-looking, the official statistical impact of these higher energy costs on inflation metrics and Gross Domestic Product may not be visible for several months.
If the current ceasefire translates into lower geopolitical risk across the Middle East, with United States objectives met and energy markets returning to historical norms, the damage to the global economy could be limited.
Trade Policy and Midterm Elections Remain an Overhang
Trade policy took a new turn in February when the Supreme Court ruled that President Trump could not use the International Emergency Economic Powers Act (IEEPA) to impose tariffs on other nations. Following that ruling, the Trump administration leveraged executive powers under Section 122 of the Trade Act of 1974 to impose a 10% global tariff for 150 days, noting the potential for that rate to increase to 15%. This ongoing tariff policy uncertainty may be difficult for corporate management teams to navigate. Without clear forward guidance on global supply chain costs, business capital expenditures and overall economic activity could remain suppressed compared to an environment with clearer trade policies.
The November midterm elections continue to act as an overhang of uncertainty because fiscal and regulatory policies may shift if control in Washington changes hands. Current polling suggests Democrats are leading the race to retake the majority in the House of Representatives, while Republicans are maintaining their lead in the Senate. We are still several months away from voting day, and investors may need to wait for the actual results before committing to a definitive investment strategy.
Paying Close Attention to Earnings Season
The passage of the One Big Beautiful Bill Act last year created an attractive tax environment for businesses. This favorable tax structure remains a fundamental backdrop supporting the broader U.S. economy and corporate profitability.
As we enter the current earnings season, investors will be focused on forward guidance from corporate management teams. Investors need to understand how companies are navigating the headwinds of higher energy costs and ongoing tariff uncertainty. There is also a lot of interest in how artificial intelligence investments are driving capital expenditures and whether those heavy upfront costs will translate into measurable productivity enhancements.
Despite the recent macroeconomic challenges, current consensus estimates for the S&P 500 Index remain relatively optimistic. According to FactSet, analysts estimate that the aggregate companies within the index could deliver continued earnings growth throughout 2026 and into 2027.2 If corporate earnings can meet or exceed these expectations, it could provide the necessary underlying support for equity markets to stabilize and build a foundation for the next leg higher.
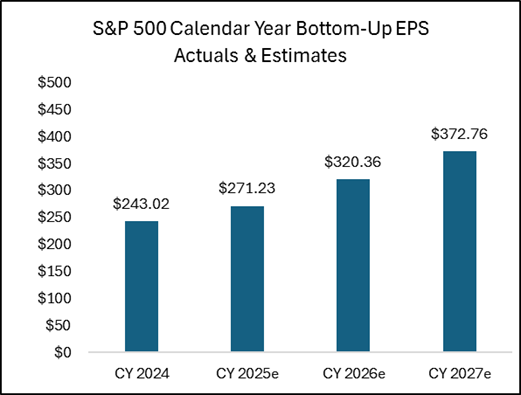
Source: FactSet.2
Fed Rate Policy on Hold for Now
At the Federal Open Market Committee meeting in March, the Federal Reserve voted to leave the federal funds rate unchanged at a target range of 3.50% to 3.75%. Looking ahead, monetary policy may see a shift in leadership. President Trump has nominated Kevin Warsh to take over the Federal Reserve Chairman position from Jerome Powell when Powell’s current term expires in May.
There is a belief among some market participants that Warsh could be supportive of lower federal funds rates but less inclined to expand the Fed’s balance sheet as a tool to manipulate longer-term interest rates. It is crucial for investors to remember that the Chairman cannot dictate interest rates unilaterally. Warsh will need to build a consensus and secure the support of other voting members on the committee to enact any major monetary policy changes.
The recent spike in energy markets tied to the conflict in Iran complicates the economic outlook for the Fed. It remains highly uncertain whether these surging energy costs will seep into the broader economy and create secondary inflationary pressures across various goods and services. If these rising input costs cause overall inflation to remain stubbornly above the Fed’s official 2% target, policymakers may be forced to keep any anticipated rate cuts on hold.
Federal funds futures currently reflect a potentially cautious Fed. According to the CME FedWatch Tool as of April 8, 2026, the market is pricing in a moderate probability of one additional rate cut this year. The highest probability (63.7%) outcome currently priced into financial markets is that the Fed remains on pause through the rest of the year.3 This suggests that interest rates could stay at their current levels until the situation in Iran stabilizes and inflation data shows a definitive downward trend.
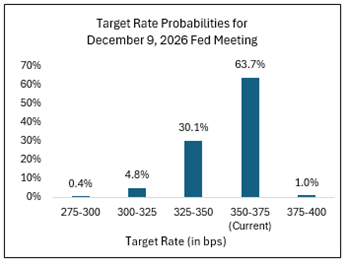
Source: CME Group as of 4/8/26.3
U.S. job growth has been inconsistent over the past twelve months. Nonfarm payrolls increased by 178,000 in March, a strong recovery from the 133,000 jobs lost during February. The unemployment rate decreased to 4.3% and remains at the lower bound of its historical range. The U.S. economy appears to remain in a low-hire and low-fire environment.
The Federal Reserve will need to evaluate the health of the workforce and balance it with a potentially stickier inflationary environment than preferred.
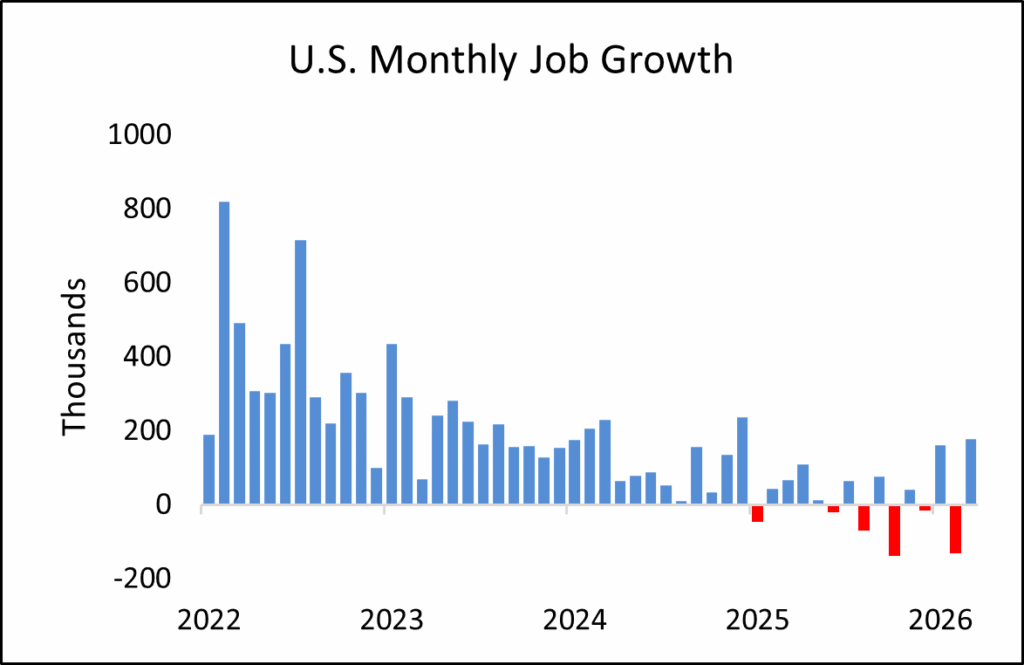
Source: U.S. Bureau of Labor Statistics.FRED.4
Q1 Market Review
Equity Markets
Global equity markets experienced extreme volatility throughout the first quarter. Both U.S. and international equity indices started the year on a solid path higher. This early rally was driven by cyclical sectors and a resurgence in domestic mid cap and small cap stocks. Investors hoped the long-awaited expansion in market breadth had finally arrived and that performance might no longer be heavily concentrated in artificial intelligence-related companies or other highly speculative areas of the market.
That optimistic sentiment shifted quickly when the United States and Israel launched military operations targeting Iranian military infrastructure. As energy markets spiked in response to the geopolitical threat, global equities sharply declined as investors aggressively sought safe-haven assets. From their recent highs, the S&P 500 Index declined approximately 10%, the technology-heavy NASDAQ 100 Index dropped roughly 13%, and the Dow Jones Industrial Average fell approximately 11%.1
International equity markets also experienced weakness during this risk-off period. Economies across Asia and Europe tend to be structurally more dependent on oil and gas exports from the Middle East, making them highly susceptible to these types of supply shocks. A rapidly strengthening U.S. dollar also acted as a headwind for domestic investors holding international assets due to corresponding foreign currency weakness.
Amid the broader market drawdown, President Trump provided a critical catalyst by announcing that his administration was engaged in constructive dialogue with Iranian officials. While the actual substance and potential outcome of the diplomatic discussions remained highly uncertain, financial markets are forward-looking and rapidly priced in the possibility of a quick resolution. This news sparked a sharp rally across global equities, and that positive momentum persisted through the end of the quarter. This culminated with President Trump’s announcement of a two-week ceasefire allowing global equities to continue to climb higher.
Despite the severe intra-quarter drawdowns, this late momentum helped mask the underlying volatility. The S&P 500 and Dow Jones Industrial Average both finished the first quarter down less than 5%, while the NASDAQ 100 Index closed the period roughly 5.9% lower. U.S. mid-cap and small-cap indices demonstrated relative strength and still managed to post positive returns for the quarter.1
Moving forward, investors must closely monitor the ongoing situation in Iran and evaluate the lingering threat of elevated energy costs. If crude oil remains expensive for an extended duration, those higher input costs could compress corporate profit margins, restrict consumer discretionary spending, and weigh heavily on broader equity markets.
Bond Markets
The U.S. bond market also experienced volatility throughout the first quarter. Investors entered the year positioned for moderate growth in the U.S. economy and generally anticipated one to three interest rate cuts from the Federal Reserve. This optimistic outlook initially pushed bond yields lower across the Treasury yield curve and sparked a rally in bond prices.
That momentum reversed quickly in March as the military conflict in Iran escalated and global energy prices jumped. Interestingly, the typical rush to safe-haven U.S. Treasuries did not materialize. Instead, yields moved higher, credit spreads widened, and bond prices declined. The immediate threat of stickier energy-driven inflation caused financial markets to reprice interest rate expectations for the remainder of the year, causing the Treasury yield curve to quickly shift higher.
For the full period, the Bloomberg U.S. Aggregate Bond Index, which measures the performance of intermediate-term U.S. investment-grade bonds, remained roughly flat. Interest rate-sensitive bonds underperformed as the Treasury yield curve shifted higher due to increased inflation concerns stemming from higher energy prices. Credit-sensitive bonds also exhibited broad weakness as investor appetite for risk deteriorated.
While corporate credit spreads have widened recently, they remain relatively tight by historical standards. The combination of rising financing costs and surging energy prices is creating an increasingly challenging macroeconomic environment. This dynamic can be an issue for highly leveraged companies that now face higher debt burdens alongside elevated operational costs.
Negative headline pressure is also building across the private credit market as participants increasingly question concentrated exposures to heavily indebted firms tied to artificial intelligence ventures. Credit investors will need to determine if this recent volatility presents a strategic buying opportunity or serves as an early warning signal for a broader downturn in the credit cycle.
Commodity Markets
The geopolitical conflict in Iran sent ripples through global commodity markets during the first quarter. Both the energy and precious metals sectors experienced significant volatility and sharp reversals from their prior trends.
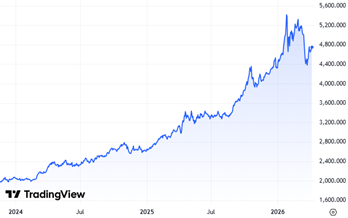
Investors quickly grew concerned about severe oil and natural gas supply shocks. Iran’s retaliatory shutdown of the Strait of Hormuz created a critical logistical bottleneck for global energy distribution. WTI Crude Oil spiked from approximately $55 per barrel from its December 2025 lows to a peak near $120 per barrel in March.
Oil remained volatile as the conflict continued but dropped below $100 per barrel following President Trump’s announcement of the two-week ceasefire with Iran. This ongoing geopolitical uncertainty suggests that oil prices could remain elevated and volatile.
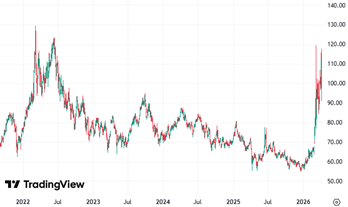
Source: TradingView.com 4/8/26.5
Gold started the quarter strong as it continued its bullish trading momentum from late 2025. The precious metal reached roughly $5,500 per ounce by the end of January. Extreme volatility soon ensued as gold quickly reversed course and declined approximately 20% in just over a week. While gold slowly rallied from those initial lower levels, it broke lower once again when the Iran conflict reignited. Gold bottomed at approximately $4,200 per ounce in March before rallying into the end of the quarter.
Source: TradingView.com. 4/8/26.7
Currency Markets
Like the other asset classes, the performance of the U.S. dollar provided a classic example of a tale of two halves in the first quarter. The year began with the U.S. Dollar Index facing notable downward pressure as it hit lower levels in late January. Markets were pricing in Fed rate cuts alongside cooling inflation data.
That entire environment shifted dramatically in March when geopolitical tensions escalated in Iran and energy prices began to spike. As global risks mounted, safe-haven demand for the U.S. dollar returned, fueled by the potential that rising oil prices could lead to stickier inflation and higher interest rates for longer.
Despite the early weakness, the U.S. Dollar Index rallied 1.7% for the full first quarter.1 If the Iran conflict can reach a quick resolution, market participants could shift their attention back to a better macroeconomic environment. This could reignite anticipations for a weaker dollar as investors re-embrace the narrative of softer inflation and a more accommodative Fed policy. If the conflict in the Middle East escalates further, global investors may continue to gravitate toward the U.S. dollar.
Market Performance
INTRUA MANAGED STRATEGIES
DYNAMIC STRATEGY
The Dynamic strategies represent diversified, multi-asset portfolios that deviate from conventional ‘asset allocation’ methodology. The Dynamic strategy is optimized on a quarterly basis utilizing an ‘Expected Tail Loss’ methodology. This method isn’t solely focused on returns; rather, it seeks to achieve the most consistent, risk-adjusted performance within the investment universe available, characterized by its dynamic and adaptive approach. Utilizing advanced quantitative analysis and a risk overlay system, the Dynamic strategies aim to deliver consistent risk-adjusted returns tailored to investors’ unique risk tolerances and objectives.
Performance Review
The Dynamic strategies produced a mixed quarter in Q1 2026, with the Moderately Conservative model leading the group and the Aggressive model finishing at the low end. Performance dispersion was driven by a clear divide between defensive and growth-oriented exposures.
Gold extended its 2025 bull run into late January before speculative deleveraging caused a sharp correction, followed by a second leg lower when the Iran conflict drove broad risk-off selling. Despite the volatile path, GLD finished the quarter up 8.6%. Models with higher gold allocations benefited meaningfully, while real asset exposure via RLY, industrials, and materials provided additional lift across the middle risk levels.
For the higher-risk models, technology was the primary headwind. Investors rotated out of crowded growth positioning as AI optimism gave way to scrutiny over capex returns and earnings delivery — software names were hit particularly hard on fears that AI itself would disrupt their business models — while sticky inflation kept rates elevated and the Iran conflict added a final risk-off blow. The Aggressive model was compounded further by meaningful financials and consumer discretionary exposure. Models with higher defensive allocations outperformed, while those concentrated in technology and financials bore the brunt of a difficult environment.
Positioning
Dynamic Conservative: Increased FSMSX, SPLG, and consumer staples (XLP) while reducing industrials (XLI) and core bonds (FIXD).
Dynamic Moderately Conservative: Increased GMSSX, real assets (RLY), and mid-cap equities (MDY) while reducing large-cap equities (LCSIX) and health care (XLV).
Dynamic Moderate: Increased industrials (XLI), short-term Treasuries (SHY), and financials (XLF) while reducing consumer discretionary (XLY) and large-cap equities (LCSIX).
Dynamic Moderately Aggressive: Increased materials (XLB) and small-cap equities (IWM) while reducing consumer staples (XLP), health care (XLV), and consumer discretionary (XLY).
Dynamic Aggressive: Increased utilities (XLU), small-cap equities (IWM), and consumer discretionary (XLY) while reducing financials (XLF) and industrials (XLI).
FLEXTREND STRATEGY
The FlexTrend strategies are structured to attempt to participate in the upside of persistent positive-trending U.S. equity and credit markets and to protect value in persistent negative-trending markets. The strategies can significantly reduce risk and raise cash and/or conservative fixed income exposure in large market drawdowns. The strategies are partially allocated to non-trend, defensively managed equity and fundamentally oriented fixed income strategies to attempt to provide further diversification. The portfolios may underperform in trendless or choppy market environments. The FlexTrend strategies utilize mutual funds and ETFs to construct the strategies.
Performance Review
The FlexTrend strategies declined in Q1 as U.S. growth stocks and credit-sensitive bonds declined. The FlexTrend strategies’ defensively managed equity holdings mitigated some downside volatility relative to the S&P 500 Index during the quarter. The strongest relative performance came from our position in a low volatility-focused equity manager, followed by positions in a valuation-sensitive manager and a trend-following manager. Our positions in option-based hedged equity managers also managed downside risk in the quarter relative to the S&P 500 Index. Our position in a U.S. large/mid cap quality growth manager was the biggest detractor followed by passive exposure to the S&P 500 Index in Q1. Our FlexTrend trading signal remained bullish throughout the quarter, and we maintain our full equity trading position at this time.
Across the FlexTrend bond allocation, our exposure to short-term bond managers was beneficial relative to core, intermediate-term bond indices as shorter-duration bond strategies generally outperformed intermediate-duration strategies in the quarter. Our exposure to credit-sensitive, tactical bond managers detracted from performance as credit markets declined in the quarter.
Positioning
The FlexTrend strategies seek long-term, risk-managed growth by blending core U.S. equity exposure with defensively managed tactical strategies. These include option-based, valuation-based, and volatility-based hedged equity strategies managed by third-party investment managers. We also manage a component of the equity allocation based on intermediate-term trend signals. Although recent volatility has increased, our intermediate-term trend signal currently remains bullish.
On March 27, 2026, we replaced a trend-following equity strategy with a more structured, option-oriented hedged equity strategy. We believe this new position serves as a diversifying complement to our existing tactical and hedged equity positions within the FlexTrend strategies.
The FlexTrend strategies seek diversified bond exposure through active managers who seek to capitalize on market dislocations. To assist in managing interest rate sensitivity, the FlexTrend strategies are currently positioned across short- and intermediate-term bond managers. Our allocation to active bond managers is designed to allow for flexibility across sectors and credit quality as market conditions evolve.
FOCUSED INCOME PORTFOLIOS
The Focused Income strategies primarily invest in higher income-generating assets. This can include dividend-paying stocks, option-income strategies, investment-grade bonds, high-yield bonds, emerging markets debt and real estate securities. The strategies’ risk exposure is not tactically managed, which can result in poor performance in weak U.S. market environments. The Focused Income strategies utilize mutual funds and ETFs to construct the strategies.
Performance Review
The Focused Income strategies declined in Q1 as global equity markets exhibited mixed performance and credit-sensitive bond markets declined. Relative to more growth-oriented equities, income-generating equities generally demonstrated greater resilience during the equity decline in Q1. Within the equity allocation, the strongest relative contributors were our positions in a mid cap dividend-paying equities manager, a global real estate income manager and an international quality dividend growth manager. Our other positions across U.S. dividend growth, valuation-oriented option income, tactical multi-asset income and closed-end fund managers delivered negative returns in the quarter, but generally outperformed core large cap U.S. and global equity indices.
Within the Focused Income bond allocations, our overweight to credit-sensitive bond managers was a primary detractor as credit markets weakened in the quarter. A position in a short-duration credit-sensitive manager had positive relative performance as its lower sensitivity to rising interest rates was beneficial. A position in an investment-grade-focused core bond manager was also a relative contributor in Q1.
For our Focused Income – Ultra-Conservative strategy, performance was effectively flat for Q1. Our structural overweight to shorter-duration bond managers served as a relative contributor as rising interest rates put downward price pressure on longer-duration bonds, allowing shorter-duration bond managers to outperform on a relative basis. This was partially offset by our positions in credit-sensitive managers that detracted as credit markets generally declined in Q1.
Positioning
The Focused Income strategies utilize a diversified, multi-asset approach intended to generate income and seek long-term capital appreciation. We allocate across diverse income sources, including global dividend-paying companies, real estate securities, closed-end funds, and option-based strategies. These multiple yield components are designed to reduce reliance on any single asset class while seeking to maintain exposure to the strategies’ capital appreciation objectives.
Within the Conservative Assets allocation, we prioritize income by overweighting our allocation to credit-sensitive bonds. The Focused Income strategies utilize active short- and intermediate-term bond managers with the intended flexibility to adjust credit exposure as market opportunities arise. This active approach seeks to generate yield while navigating changing market environments.
PRESERVE & PARTICIPATE PORTFOLIOS
The Preserve & Participate strategies take a modern, risk-first approach to portfolio construction. Instead of traditional asset allocation, the strategy uses Q Methodology™ to optimize portfolios based on historical drawdown targets and risk-adjusted return potential. By combining equities, fixed income, and commodities through low-cost ETFs, the models aim to maximize return for each unit of risk taken—aligning with each investor’s unique risk profile.
Performance Review
The P&P strategies delivered a clear risk/return outcome in Q1 2026, with the conservative models generating positive returns and the higher-risk models finishing in negative territory.
Precious metals and consumer staples were the primary drivers at the conservative end. Gold continued its bull run through late January before an initial unwind and a second leg lower on the Iran conflict, ultimately finishing the quarter firmly positive, and staples exposure added a meaningful tailwind — particularly in P&P 10. P&P 30 sat in the middle, capturing gains from gold, staples, utilities, and industrials that were more than offset by heavy technology and consumer discretionary exposure.
The higher-risk models were dominated by technology drag. XLK averaged close to 40% across P&P 45 and P&P 60, and the same macro and sentiment pressures that weighed on growth names broadly hit these models hardest. Consumer discretionary added further drag, and P&P 60 was compounded by financials exposure earlier in the quarter before rotating into industrials late — a shift that partially offset losses but came too late to change the outcome.
Positioning
P&P 5: Increased health care (XLV) while reducing gold (GLD).
P&P 10: Increased core bonds (BND) and gold (GLD) while reducing short-term Treasuries (SHY, SCHO) and physical gold (PHYS).
P&P 20: Increased consumer staples (XLP) and long-term bonds (BLV) while reducing long-duration Treasuries (TLT), short-term Treasuries (SHY), technology (XLK), and health care (XLV).
P&P 30: Increased consumer staples (XLP) and health care (XLV) while reducing consumer discretionary (XLY), gold (GLD), long-duration Treasuries (TLT), and core bonds (BND).
P&P 45: Increased health care (XLV) while reducing consumer discretionary (XLY).
P&P 60: Increased industrials (XLI) and health care (XLV) while reducing consumer discretionary (XLY), financials (XLF), and physical gold (PHYS)
TOTAL RETURN/TOTAL RETURN ETF PORTFOLIOS
The Total Return and Total Return ETF strategies provide long-term diversified exposure across U.S. and international equities, bonds and income-generating assets. The strategies are structured to participate in the upside of bullish equity and credit markets and provide moderate income generation. The strategies’ risk exposure is not tactically managed and can result in poor performance in weak market environments. The Total Return strategies utilize mutual funds and ETFs to construct the portfolios, while the Total Return ETF strategies only utilize ETFs to construct the strategies.
Performance Review
The Total Return strategies experienced a decline in Q1 as global equity and bond markets faced broad-based volatility. Exposures to U.S. large and mid cap growth stocks were the largest overall detractors from performance in the quarter. Passive exposure to the S&P 500 Index was also a key detractor in Q1. Our exposures to global equity managers and closed-end funds also negatively impacted results in the quarter. The strongest relative contributor in Q1 was our exposure to emerging market equities. Other areas of relative outperformance came from our positions in higher-quality international large caps and international small caps as these areas delivered positive returns in Q1. In our Total Return ETF strategies, a tactical multi-asset income strategy also contributed to relative performance in the quarter.
In the Total Return taxable bond allocation, performance was mixed across the active bond managers that we allocate to. The weakest performance was driven by our allocation to credit-sensitive, tactical bond managers as credit markets generally weakened in Q1. In the Total Return Muni strategies’ bond allocation, results were mixed across the active bond managers, but their positioning allowed stronger performance relative to core, intermediate-term muni bond indices in the quarter.
Positioning
The Total Return strategies seek capital appreciation and income through broad diversification. Equity exposure spans U.S. and foreign markets, diversified by market capitalization and investment style. To help generate income, we maintain allocations to a tactical, multi-asset income-generating manager and closed-end funds. We believe this approach of diversified, global equity exposure plus income generation could help balance the Total Return strategies across different market environments.
The Total Return strategies utilize active bond managers to provide diversified exposure across the bond markets. We allocate across core bond managers focused on higher-quality, investment-grade debt and tactical managers who can adjust risk across sectors, duration and credit quality. We believe this combination could provide the Total Return strategies with an opportunity to effectively navigate through various bond market environments.
U.S. CORE/U.S. CORE ETF PORTFOLIOS
The U.S. Core and U.S. Core ETF strategies provide long-term exposure to core U.S. equity and bond markets. The strategies may have some exposure to non-core markets, including foreign assets and lower-quality fixed income. The strategies are structured to participate in the upside of bullish U.S. equity and credit markets. The strategies’ risk exposure is not tactically managed and can result in poor performance in weak U.S. market environments. The U.S. Core strategies utilize mutual funds and ETFs to construct the strategies, while the U.S. Core ETF strategies only utilize ETFs to construct the portfolios.
Performance Review
The U.S. Core strategies declined in Q1 as U.S. growth stocks and credit-sensitive bond markets faced downward pressure. The largest equity detractors in the quarter were from our exposure to U.S. large and mid cap growth stocks and a valuation-focused manager. Passive exposure to the S&P 500 Index was also a detractor in Q1. Our exposure to a dividend growth equity manager helped to mitigate volatility relative to the broader decline in growth stocks for the quarter. Our dedicated position in an equity manager focused on higher-quality small caps was a relative positive contributor in the U.S. Core strategies in the quarter. In the U.S. Core ETF strategies, exposure to a diversified, valuation-focused manager also generated positive performance in Q1.
In the U.S. Core strategies’ taxable bond allocation, our exposure to active bond managers delivered mixed results. Bond managers with less interest rate sensitivity and less credit exposure outperformed those tactical bond managers with higher credit exposure as credit markets were generally weaker in Q1. In the U.S. Core Muni strategies’ muni bond allocations, the active bond managers’ performance exceeded that of core, intermediate-term investment-grade muni bond indices for the quarter.
Positioning
The U.S. Core strategies provide broad equity exposure by blending traditional market-cap and factor-based indices with active management from third-party investment managers. The strategies seek diversification across growth, core, and value styles and market capitalization. We maintain a preference toward companies with stronger balance sheets and the potential for sustainable growth, with the objective of providing a diversified core equity foundation for long-term investors.
The U.S. Core strategies utilize a multidimensional approach to investing in the bond markets, providing exposure across diverse sectors, credit tiers, and maturities. We utilize active core and tactical bond managers who we believe offer the experience needed to try to navigate today’s shifting bond environments. This allocation to active bond managers seeks to provide the portfolio with a flexible foundation through evolving credit cycles.
US CORE X STRATEGY
The U.S. Core X strategy provides long-term exposure to core U.S. equity and bond markets. The strategies may have some exposure to non-core markets, including foreign assets and lower-quality fixed income. The strategies are structured to participate in the upside of bullish U.S. equity and credit markets. The strategy is tactical in nature, allowing for the use of leveraged investments to attempt to generate higher returns. The use of leveraged investments can increase the risk of the strategy. Leveraged investments should be considered speculative investments and may not be suitable for all investors.
Performance Review
The U.S. Core X strategy declined in Q1 as U.S. equities were challenged. The strongest relative contributors to the strategy were exposures to leveraged core U.S. mid caps and an equity manager that focuses on higher-quality small caps, as mid and small caps generally outperformed other holdings in Q1. With U.S. large cap core and growth stocks experiencing weakness in the quarter, our leveraged exposure to the S&P 500, NASDAQ 100 and Dow Jones Industrial Average was a material detractor. Other detractors included non-leveraged exposure to the S&P 500 Index, high-quality large/mid cap stocks, a valuation-conscious equity manager and mid cap growth stocks.
Positioning
In early January, following U.S. mid cap stocks reaching an internal price target, leverage was reduced from an overweight position to a neutral level. Since that reduction in leverage, the U.S. Core X strategy has maintained a neutral risk level across all target leveraged positions. With recent market volatility, the U.S. Core X strategy continues to be monitored for potential tactical rebalancing opportunities and the possibility of increased leveraged exposure should areas of the U.S. equity market decline to pre-determined target levels.
Non-leveraged exposure remains positioned across a mix of passive exposure to the S&P 500 Index, factor-weighted equity indices and actively managed strategies. This exposure is intended to provide diversification across U.S. market cap and growth/core/value investment styles.
CONCENTRATED GROWTH SMA PORTFOLIOS
The Concentrated Growth SMA is a focused portfolio of ~40 U.S. large- and mid-cap stocks selected for high returns on invested
capital (ROIC), strong profitability, and reinvestment potential. Using a systematic, quarterly ranking process and a cyclically adjusted
ROE screen, the strategy targets companies with scalable business models and long-term growth prospects. Direct security
ownership helps minimize fees and improve long-term outcomes.
Performance Review
The Concentrated Growth strategy faced a difficult quarter as an early rotation into value drove underperformance across growth equities. This backdrop, combined with risk-off sentiment tied to the Iran conflict, weighed on much of the portfolio.
Fair Isaac (-36.9%), Qualys (-33.9%), FactSet (-24.9%), Manhattan Associates (-23.2%), and Booking Holdings (-21.2%) were the largest detractors. The declines were driven primarily by multiple compression as investors moved away from higher-valuation growth stocks. Software names were additionally pressured as AI raised concerns around business model durability, driving a sharp negative shift in sentiment. Booking Holdings also declined alongside other consumer-facing names as macro uncertainty weighed on discretionary spending.
Defensive positioning provided a partial offset. Coca-Cola Consolidated (+25.3%) and Jabil (+16.5%) were the top contributors, while Bristol-Myers Squibb (+13.8%), McKesson (+5.6%), and Service Corporation International (+6.3%) also delivered positive returns.
Positioning
No Changes
MOAT SMA PORTFOLIOS
The MOAT SMA invests in U.S. large-cap companies with durable competitive advantages, or “economic moats,” such as brand
strength, cost efficiency, or regulatory barriers. Leveraging Morningstar’s moat ratings and fundamental valuation methods, the
strategy seeks to build a risk-aware, long-term growth portfolio focused on capital preservation and consistent outperformance
relative to broad market indices.
Performance Review
The MOAT strategy faced a challenging quarter, with the broad selloff in risk assets weighing heavily on the portfolio. Workday (-39.5%), Adobe (-30.6%), Salesforce (-29.5%), and Estee Lauder (-31.3%) were the largest detractors. Software names were hit particularly hard as the market increasingly questioned the durability of their business models in an AI-driven environment, with sentiment turning sharply negative on names perceived as most vulnerable to disruption. The Iran conflict’s risk-off selling amplified the drawdowns into quarter end.
Bright spots were concentrated in defense and semiconductors. Huntington Ingalls (+12.1%) benefited directly from the geopolitical backdrop, while Applied Materials (+33.2%) was the standout performer and the largest contributor on the period. The March rebalance added NVDA, AVGO, FICO, PANW, and DDOG as the tech selloff created attractive entry points, while trimming names that had run significantly. The portfolio enters Q2 with increased technology exposure following the quarter’s dislocation.
Positioning
Added
ZTS, MAS, NVDA, LPLA, BX, CSGP, AVGO, VEEV, FICO, PANW, DDOG
Removed
JKHY, UPS, IEX, BA, DE, MRK, AMGN, HII, ADBE, CRM, WDAY
A, ADBE, ADSK, ALLE, AMAT, AMGN, AMZN, BA, BFB, BMY, CAT, CDNS, CLX, CPB, CRM, CTVA, DHR, DIS, EL, GEHC, GOOGL, HII, HSY, IEX, IFF, KVUE, LRCX, MANH, MAS, MCHP, MDLZ, MKTX, MPWR, MRK, MSFT, NDSN, NKE, NOC, NXPI, ORCL, PEP, PFE, SCHW, SNPS, STZ, TER, TMO, TRU, UPS, USB, VEEV, WDAY, WST, ZBH
QUALITY DIVIDEND SMA PORTFOLIOS
The Quality Dividend SMA targets financially strong U.S. large-cap companies with a history of stable and growing dividends. Rather
than chasing high yields, the strategy emphasizes balance sheet strength, earnings consistency, and dividend coverage, selecting
the top dividend growers in each sector. This results in a diversified, lower-volatility portfolio built for income and long-term growth.
Performance Review
The Quality Dividend strategy delivered a strong quarter, finishing up approximately 7% and outperforming the broader equity market meaningfully. Performance was largely a tale of two groups. Energy was the standout — Exxon Mobil (+42.0%), EOG Resources (+39.0%), and Chevron (+37.1%) were the top three performers, as the oil shock following the Iran conflict drove a massive repricing in the energy complex. Lockheed Martin (+25.6%) and Archer-Daniels-Midland (+27.4%) rounded out the best contributors, reflecting the defensive and geopolitical tailwinds that defined the quarter.
Qualcomm (-24.2%) was the largest detractor, declining on weaker forward guidance. Medtronic (-9.1%), AvalonBay (-8.9%), Morgan Stanley (-6.8%), and Omnicom (-5.8%) also weighed on results. The portfolio’s income-oriented diversification across energy, utilities, and industrials provided meaningful ballast, with the energy positions more than offsetting weakness elsewhere and driving a result that stands out relative to most equity strategies on the period.
Positioning
No Changes
SOURCES
1. Morningstar Direct. Performance provided as total returns. U.S. Mid Caps is defined by the Russell Mid Cap TR USD index. U.S. Small Caps is defined by the Russell 2000 TR USD index. U.S. Growth is defined by the Russell 3000 Growth TR USD index. U.S. Value is defined by the Russell 3000 Value TR USD index. International Developed is defined by the MSCI EAFE NR USD index. Emerging Markets is defined by the MSCI Emerging Markets NR USD index. U.S. Agg Bond is defined by the Bloomberg U.S. Aggregate Bond TR USD index. U.S. Investment Grade Corp is defined by the Bloomberg U.S. IG Corp USD 300 M TR USD Index. U.S. High Yield is defined by the Bloomberg High Yield Corporate TR USD index. Broad Commodities is defined by the Bloomberg Commodity TR USD index. WTI Crude Oil is defined by the Bloomberg Sub WTI Crude Oil TR USD Index. Gold is defined by the Bloomberg Sub Gold TR USD Index. Industrial Metals is defined by the Bloomberg Sub Industrial Metals TR USD Index. Short-Term Treasuries defined by the Bloomberg 1-3 Yr U.S. Treasury TR USD index. Intermediate-Term Treasuries defined by the Bloomberg Intermediate U.S. Treasury TR USD Index. Long-Term Treasuries defined by the Bloomberg Long-Term U.S. Treasury TR USD Index.
2. FactSet. Earnings Insight. 4/2/26.
3. CME Group. FedWatch Tool. Retrieved 4/8/26 from https://www.cmegroup.com/markets/interest-rates/cme-fedwatch-tool.html
4. U.S. Bureau of Labor Statistics, All Employees, Total Nonfarm [PAYEMS], retrieved from FRED, Federal Reserve Bank of St. Louis; https://fred.stlouisfed.org/series/PAYEMS, April 6, 2026.
5. TradingView.com. WTI Crude Oil. Retrieved 4/8/26 from https://www.tradingview.com/chart/S5oI8Odc/?symbol=TVC%3AUSOIL
6. TradingView.com. Gold. Retrieved 4/8/26 from https://www.tradingview.com/chart/S5oI8Odc/?symbol=TVC%3AGOLD
IMPORTANT DISCLOSURES
The opinions voiced in this material are for general information only and are not intended to provide or be construed as providing specific investment advice or recommendations for any individual security.
Any economic forecasts set forth in the presentation may not develop as predicted and there can be no guarantee that strategies promoted will be successful.
The term “portfolios” used in this piece is in reference to the Intrua Financial model portfolios. Any reference to performance is based on estimated, unaudited, gross of fee performance of the model portfolios. Model portfolio performance is calculated through Morningstar Direct based on model portfolio holdings. Client accounts assigned a Intrua Financial model portfolio may have positioning and performance that differs from the firm’s model portfolios at any given time.
There is no assurance that the techniques and strategies discussed are suitable for all investors or will yield positive outcomes. The purchase of certain securities may be required to affect some of the strategies. Investing in stocks includes numerous specific risks including: the fluctuation of dividend, loss of principal and potential illiquidity of the investment in a falling market.
Bonds are subject to market and interest rate risk if sold prior to maturity. Bond and bond mutual fund values and yields will decline as interest rates rise and bonds are subject to availability and change in price. Government bonds and Treasury bills are guaranteed by the U.S. government as to the timely payment of principal and interest and, if held to maturity, offer a fixed rate of return and fixed principal value. However, the value of fund shares is not guaranteed and will fluctuate.
Investing in stock includes numerous specific risks including: the fluctuation of dividend, loss of principal, and potential illiquidity of the investment in a falling market.
Asset management does not ensure a profit or protect against loss. There is no guarantee that a diversified portfolio will enhance overall returns or outperform a non-diversified portfolio. Diversification does not protect against market risk.
The fast price swings in commodities will result in significant volatility in an investor’s holdings. Commodities include increased risks, such as political, economic, and currency instability, and may not be suitable for all investors.
Precious metal investing involves greater fluctuation and the potential for losses.
Alternative investments may not be suitable for all investors and should be considered as an investment for the risk capital portion of the investor’s portfolio. The strategies employed in the management of alternative investments may accelerate the velocity of potential losses.
International investing involves special risks such as currency fluctuation and political instability and may not be suitable for all investors. These risks are often heightened for investments in emerging markets.
Securities offered through LPL Financial. Member FINRA/SIPC. Investment advice offered through Intrua Financial, LLC, a registered investment advisor and separate entity from LPL Financial.
This research material has been prepared by Intrua Financial, LLC.