

OCTOBER 2026
Q3 Investment Commentary
Oil Spikes, Interest Rates Shift Higher, Equities Mixed
Throughout Q3 2026, rebounding energy prices and higher interest rates pressured broader financial markets. The escalating conflict in Iran drove increases across crude and refined fuels, raising concerns that these input costs could contribute to additional inflation, negatively impacting consumers and businesses.
Faced with renewed inflationary pressures, the Federal Reserve, led by new Fed Chair Kevin Warsh, responded by raising the federal funds rate by 25 basis points (0.25%) in September to a target range of 3.75% to 4.00%. The Fed continued to signal its commitment to anchoring long-term inflation expectations.
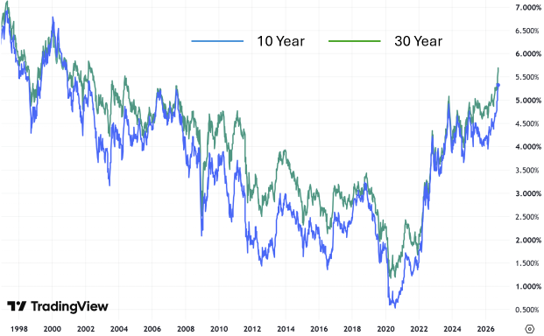
As inflation remained sticky, U.S. Treasury yields pushed higher across the curve as bond investors repriced the market, placing downward pressure on interest rate-sensitive bonds. The heavily watched U.S. 10-year Treasury yield climbed above 5.0% to trade near 5.35%, at levels not seen since 2002. A heavy surge in corporate bond issuance this year, coupled with total U.S. government debt eclipsing $40 trillion, compounded supply-side pressures across bond markets. These elevated yields could tighten financial conditions for consumers and corporate borrowers alike.
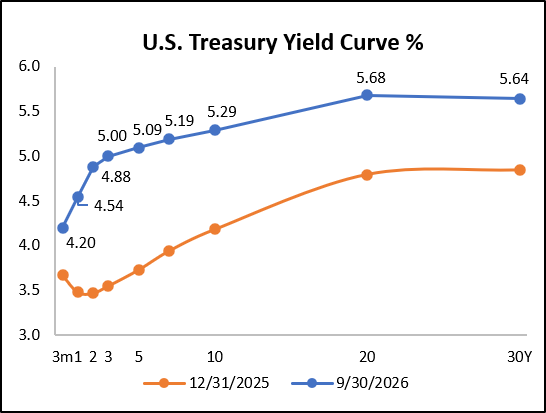
Source: Treasury.gov2
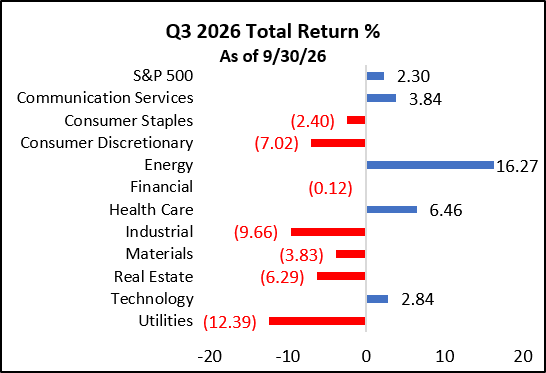
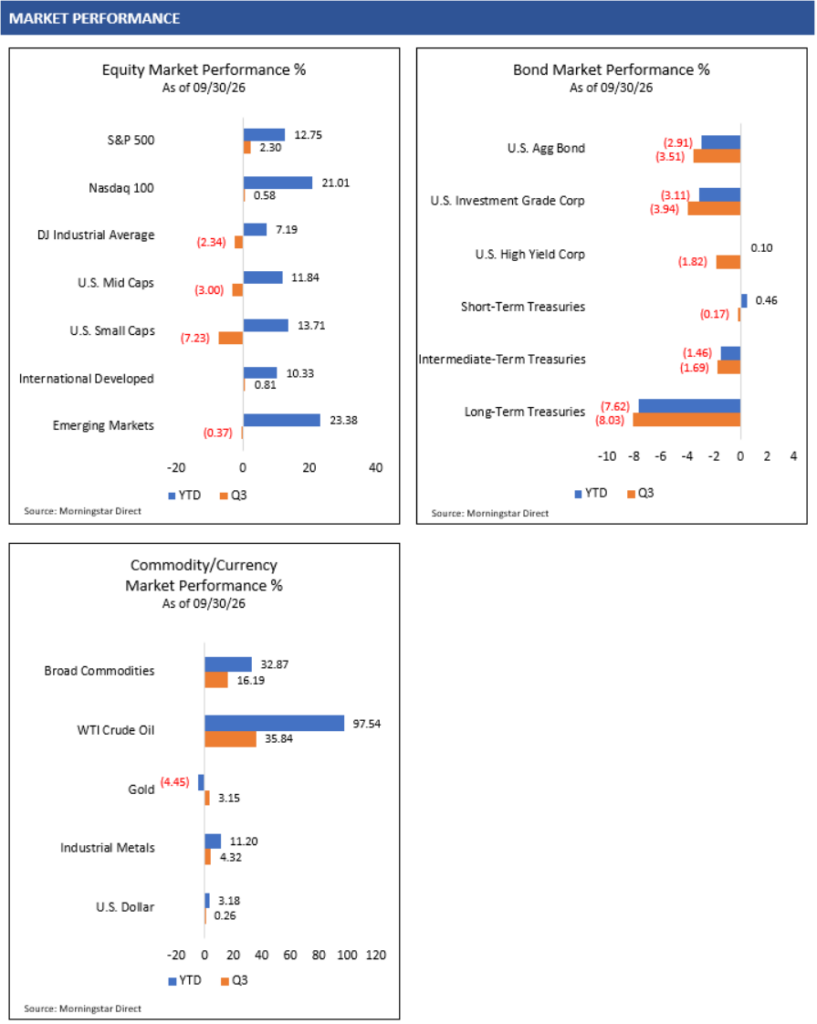
Against a backdrop of rising energy costs and elevated interest rates, equity markets delivered mixed performance in Q3. While the S&P 500 gained 2.30% and the technology-heavy Nasdaq 100 moved 0.58% higher, these headline returns masked significant underlying volatility.1 Cyclical and rate-sensitive sectors bore the brunt of the pressure, as capital rotated back into secular AI buildout beneficiaries and cash-rich balance sheets better insulated from macroeconomic headwinds.
Fed Balances Inflation Fight with Employment Stability
The Federal Reserve remains focused on its dual mandate of price stability and maximum employment to chart the course for monetary policy. While the more well-known Consumer Price Index (CPI) captures headline household costs, policymakers rely heavily on the Core Personal Consumption Expenditures (PCE) Index, which strips out volatile food and energy, to gauge structural inflation trends and calibrate the trajectory of benchmark interest rates.
As illustrated in the following chart, the Core PCE Index continues to run persistently above the Fed’s 2% long-term inflation target, while unemployment sits near the lower boundary of its 20-year range. With the labor market remaining fundamentally sound, policymakers could retain the flexibility to prioritize price stability over near-term employment support.
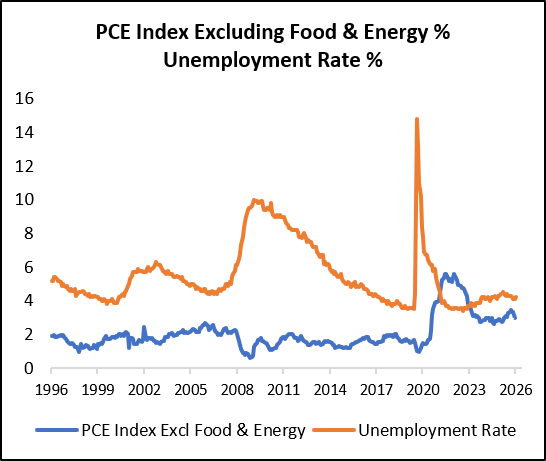
Source: FRED3
Amid persistent inflation, and even following the Fed’s 25 basis point rate hike in September, financial markets are pricing in one to two additional 25 basis point hikes before year-end, with the potential for further rate hikes in 2027. Investors continue monitoring incoming data closely to gauge whether sustained economic momentum could prompt further Federal Reserve rate hikes and how those moves might affect various asset classes.
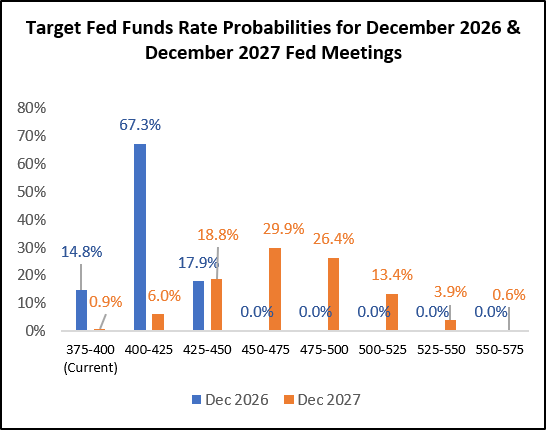
Source: CME Group4 as of 10/3/26
Wholesale Inflation Threatens Consumer Budgets
Inflation continues to challenge the corporate sector, where margin pressures typically emerge before hitting household budgets. Over the 12 months ending August 2026, the Producer Price Index rose 5.4%, signaling persistent wholesale cost acceleration.5 Surging energy costs served as the primary catalyst, while food prices remained relatively flat. Within services, price pressures stayed elevated, led by transportation and warehousing, where higher diesel fuel costs fed into freight and distribution services.
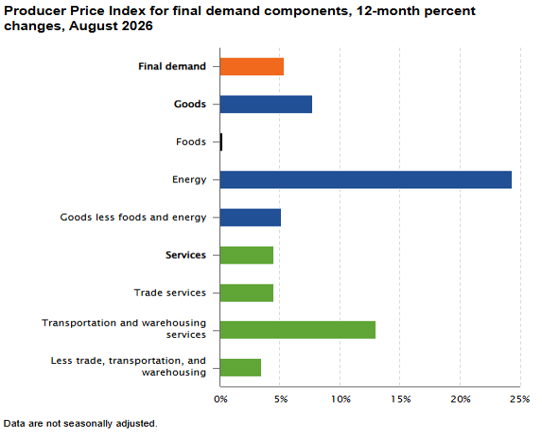
Source: U.S. Bureau of Labor Statistics5
Because businesses often find it difficult to absorb prolonged input cost increases, many companies look to pass a portion of these expenses downstream to end users. As a result, persistent strength across wholesale goods and services points to continued upward pressure on upcoming Consumer Price Index (CPI) readings, potentially threatening to squeeze household purchasing power in the months ahead.
Stable U.S. Economic Growth Amid Higher Rates, For Now
U.S. economic growth is projected to hold relatively steady heading into 2027, with Wall Street Journal survey economists forecasting Real GDP between 2.0% and 2.5%.6 Yet much like the equity markets, headline stability masks underlying divergence as interest rate-sensitive sectors, particularly consumer discretionary and real estate, remain vulnerable to a higher-for-longer interest rate environment.
We continue to see strength in U.S. manufacturing and services sectors, with September Purchasing Managers’ Index (PMI) readings of 54.5 (manufacturing) and 54.9 (services) reflecting economic expansion. Although headline PMI readings indicate solid expansion, price subindices of 77.9 in manufacturing and 74.0 in services highlight persistent inflationary pressures spreading across the broader economy.7
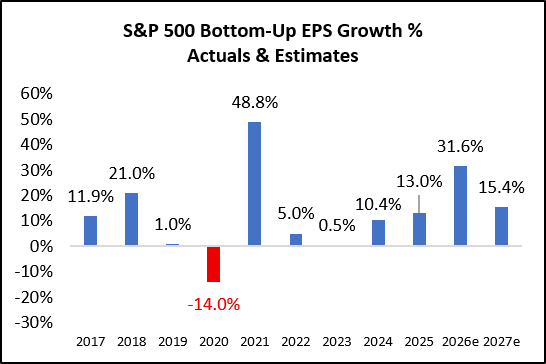
U.S. corporate earnings continue to show notable strength, with consensus forecasts targeting over 30% S&P 500 EPS growth in 2026 and double-digit gains into 2027.8 Even after accounting for typical downward revisions as forecasts mature, these elevated profit expectations could provide support for U.S. equities heading into next year.
Source: FactSet8
Markets are closely watching the conflict in Iran for supply-driven oil spikes that could reignite inflation and keep interest rates higher for longer. Higher borrowing costs risk curbing consumer and business spending, slowing U.S. economic momentum, and creating potential headwinds for corporate profitability and the financial markets.
Navigating Markets as Midterm Elections Near
As news headlines shift some focus toward the upcoming midterm elections, consensus forecasts point to Democrats potentially reclaiming the House majority, while the Senate appears closely contested. Historically, financial markets have generally favored a divided government. Political gridlock often acts as a natural check against sweeping fiscal overhauls and aggressive policy changes, fostering a more predictable tax and regulatory environment for consumers and businesses.
For long-term investors, investment fundamentals like earnings power, balance sheet strength, and cash flow generation often drive investment performance more than the short-term noise of Washington politics.
Q3 Market Review
Equity Markets
Equity volatility picked up in the second half of Q3 as oil prices and bond yields moved higher. While the S&P 500 Index closed the quarter up 2.3%1, that headline gain masked significant dispersion beneath the surface. Energy led all sectors on the strength of oil prices, while balance sheet strength and secular demand helped communication services, technology, and health care post solid gains despite higher rates.
Mid and small cap companies and economically sensitive sectors struggled in Q3, led lower by consumer discretionary, industrials, materials, and real estate. Utilities also faced headwinds as rising bond yields created stiffer competition for dividend-seeking investors.
Source: S&P 500 Sector Performance (Total Return). Morningstar Direct.1
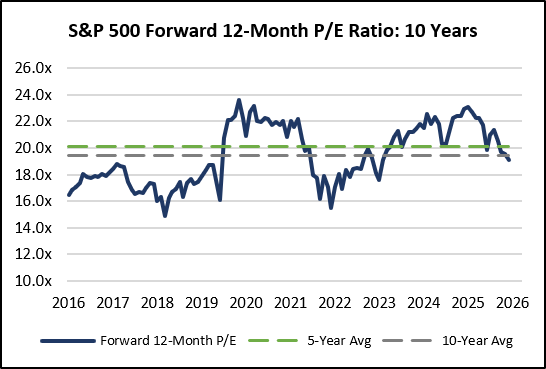
Even with strong year-to-date returns across U.S. equities, earnings growth has outpaced price appreciation, driving the forward 12-month P/E multiple for the S&P 500 Index down from 22.2x at the end of 2025 to 19.1x at the end of September 2026. This multiple compression may provide a more moderate valuation environment, which could help support investor demand for U.S. stocks heading into next year.
Source: FactSet. As of 9/30/26.9
International equity markets posted mixed results in Q3. Developed markets held steady, with the MSCI EAFE Index returning 0.81%, while the MSCI Emerging Markets Index, with its heavy concentration in Asian technology hardware and semiconductors, declined -0.37%.1
Bond Markets
Bond markets were broadly weaker in Q3, with the Bloomberg U.S. Aggregate Bond Index down -3.51% and longer-duration Treasuries declining even further.1 Bond yields have pushed higher across the curve as markets price in persistent inflation and a higher federal funds rate under the Fed’s restrictive monetary policy. Interestingly, this has created a policy divergence between the Fed and the U.S. Treasury.
While the Fed maintains a restrictive stance to tame inflation, some market observers note that the U.S. Department of the Treasury’s efforts to absorb supply through buybacks could work against the central bank’s goal of tightening financial conditions.
U.S. Treasury Yields
Source: TradingView.com. As of 10/8/2610
Whether the U.S. Treasury can successfully counter these upward rate pressures and the Fed’s tightening remains to be seen, particularly against the backdrop of continued U.S. fiscal deficits, elevated Treasury auction sizes, and heavy corporate bond issuance.
Credit spreads remain historically tight, reflecting investor confidence in corporate balance sheets, even as corporate issuance accelerates sharply. Heavy borrowing by tech hyperscalers to fund AI capex is driving a wave of investment-grade bond supply. As bond markets digest this volume alongside heavy Treasury issuance, the supply overhang is driving yields higher and pressuring the prices of existing bonds.
Commodity Markets
Energy prices remain volatile amid recurring setbacks in diplomatic efforts between the U.S. and Iran. Early in Q3, WTI Crude traded below $70 per barrel on hopes of regional de-escalation. As talks stalled and hostilities reignited, however, crude surged past $100 per barrel before settling at $90 per barrel, capping a 35.84% gain at the end of the quarter.1,12
U.S. Regular Gas and Diesel Prices
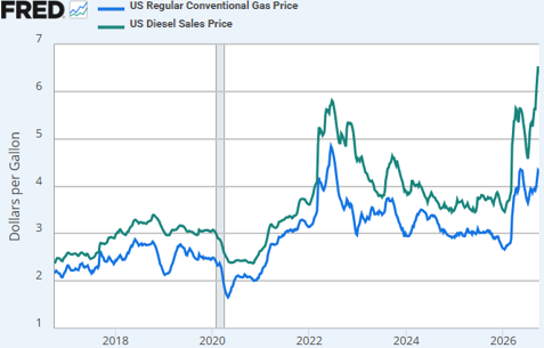
Source: FRED Weekly as of 9/28/26.11
Persistently high energy prices threaten to flow through production and logistics into consumer prices. If entrenched across supply chains, these costs could keep inflation uncomfortably high for an extended period. Regular gas prices have continued to press higher while diesel prices, which impact transportation costs, have hit record highs.
Gold experienced heightened volatility throughout Q3 2026 as pressure from climbing Treasury yields clashed with safe-haven demand. Gold rallied 3.15% in the quarter.1 Federal Reserve policy tightening and higher bond yields have elevated the opportunity cost of holding non-yielding assets like gold, prompting conservative investors to consider rotating toward fixed income for reliable cash flow.
Geopolitical friction and macroeconomic uncertainty continue to support gold demand. Over the past few years, central banks seeking currency reserve diversification have been accumulating gold on pullbacks, providing an underlying source of demand. Looking ahead, market participants will watch closely to see whether this sovereign demand holds up against a higher-for-longer interest rate environment.
Gold Price
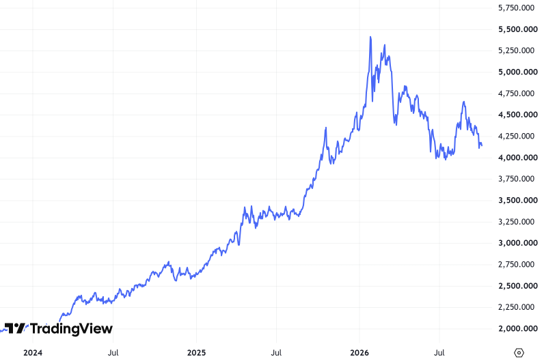
Source: TradingView.com 10/3/2613
Currency Markets
The U.S. dollar also experienced choppy trading across much of Q3 2026, whipsawed by shifting geopolitical risks and fluctuating growth expectations. With the Federal Reserve hiking the fed funds rate in September, bond yields climbing across the curve, and U.S. economic growth remaining resilient, dollar-denominated assets drew renewed demand, driving the currency higher into quarter end. A continued rally in the U.S. dollar could be a headwind for U.S. investors holding international assets with foreign currency exposure. Consequently, investors should monitor this additional source of volatility closely as currency swings unfold.
Market Performance
INTRUA MANAGED STRATEGIES
DYNAMIC STRATEGIES
The Dynamic strategies represent diversified, multi-asset portfolios that deviate from conventional ‘asset allocation’ methodology. The Dynamic strategy is optimized on a quarterly basis utilizing an ‘Expected Tail Loss’ methodology. This method isn’t solely focused on returns; rather, it seeks to achieve the most consistent, risk-adjusted performance within the investment universe available, characterized by its dynamic and adaptive approach. Utilizing advanced quantitative analysis and a risk overlay system, the Dynamic strategies aim to deliver consistent risk-adjusted returns tailored to investors’ unique risk tolerances and objectives.
Performance Review
The Dynamic strategy generated mixed results in Q3, with Dynamic Conservative the best performer and Dynamic Moderately Aggressive the worst. The quarter’s dominant backdrop was a shift in Fed policy: in September, the Fed delivered its first rate hike since 2023, a 25-basis-point move to 3.75%–4.00% on persistent, tariff-linked inflation, pushing the 10-year Treasury yield to its highest level in over two decades. That hit several of the suite’s exposures directly — long Treasuries (TLT) followed yields lower, and utilities (XLU) saw their dividend appeal diminish against higher risk-free rates — while industrials (XLI), small caps (IWM), and consumer discretionary (XLY) lagged on higher borrowing costs.
The same environment proved unusually supportive for gold and trend-following strategies. Gold (GLD) rose despite the rate hike, as a hawkish surprise from a still-new Fed chair and a widening fiscal deficit reinforced demand for gold as a policy hedge. Managed futures (GMSSX) was the strongest exposure in the lineup, benefiting from the kind of sustained, trending moves — rising yields, a firmer dollar, climbing gold and oil — that trend-following strategies are built to capture. Technology (XLK) and core S&P 500 exposure also advanced, rounding out a quarter where gains concentrated in liquid alternatives, gold, and technology while several cyclical and defensive-income sectors broadly lagged. Overall, the model set benefited more from its alternative and gold exposure than from its traditional equity and bond sleeves this quarter.
Positioning
Dynamic Conservative: Increased GMSSX, core bonds (FIXD), large-cap equities (LCSIX), technology (XLK), health care (XLV), and consumer discretionary (XLY) while reducing S&P 500 exposure (SPLG), gold (GLD), long-duration Treasuries (TLT), short-term Treasuries (SHY), real assets (RLY), and FSMSX.
Dynamic Moderately Conservative: Increased technology (XLK), large-cap equities (LCSIX), FSMSX, consumer staples (XLP), and core bonds (FIXD) while reducing S&P 500 exposure (SPLG), long-duration Treasuries (TLT), industrials (XLI), and gold (GLD).
Dynamic Moderate: Increased S&P 500 exposure (SPLG), FSMSX, industrials (XLI), and health care (XLV) while reducing large-cap equities (LCSIX), real assets (RLY), technology (XLK), financials (XLF), consumer discretionary (XLY), and gold (GLD).
Dynamic Moderately Aggressive: Increased consumer discretionary (XLY), financials (XLF), health care (XLV), gold (GLD), and S&P 500 exposure (SPLG) while reducing real assets (RLY), industrials (XLI), technology (XLK), and utilities (XLU).
Dynamic Aggressive: Increased industrials (XLI), S&P 500 exposure (SPLG), utilities (XLU), consumer staples (XLP), and technology (XLK) while reducing consumer discretionary (XLY), financials (XLF), materials (XLB), and gold (GLD).
FLEXTREND STRATEGIES
The FlexTrend strategies seek long-term, risk-managed growth by blending core U.S. equity exposure with diversified exposure across defensively managed equity strategies. These may include trend-, option-, valuation-, volatility-based and other hedged equity strategies. The Investment Committee will also tactically adjust equity exposure based on intermediate-term price trends in the U.S. equity market. Conservative assets are allocated to actively managed bond strategies that can tactically adjust exposures across various market environments. The FlexTrend strategies may underperform in aggressive momentum or trendless, choppy market environments.
Performance Review
The FlexTrend strategies generated positive performance in Q2 as U.S. equity and credit markets rallied. The strongest contributors to performance in the quarter included passive exposure to the S&P 500 Index, U.S. quality growth stocks, U.S. dividend growth stocks and a tactical low-volatility, cash-managed equity strategy. Our exposure to options-based hedged equity strategies was also additive, but these strategies generally lagged the S&P 500 Index in the quarter, as hedged strategies are anticipated to lag in a strong equity market rally. Our allocation to a valuation-sensitive strategy was also positive in the quarter, but it was the weakest equity-related strategy in Q2. The S&P 500 Index maintained its bullish trend throughout Q2, which resulted in our remaining fully invested in our tactical U.S. equity trading position for the duration of the quarter, benefiting performance.
In our FlexTrend strategies’ allocation to bonds, our exposure to active short-term and tactical bond managers was solidly positive in the second quarter. Our allocation to credit-sensitive tactical bond managers was a significant contributor to performance relative to the core bond index in Q2, as credit markets bounced back from weakness in Q1. Positioning in active short-term bond managers was positive, but these managers lagged the tactical bond managers in the quarter.
Positioning
The FlexTrend strategies target long-term, risk-conscious growth by combining core U.S. equity exposure with defensive, tactically managed equity strategies. This allocation incorporates option-, valuation-, and volatility-based hedged equity strategies managed by third-party investment managers. Additionally, we actively manage a portion of the equity portfolio, guided by intermediate-term trend indicators. As the U.S. S&P 500 Index continues to trend higher, our intermediate-term trend signal remains bullish, and we are positioned accordingly.
The FlexTrend strategies allocate to diversified bond exposure by utilizing active managers equipped to navigate the complexities of the bond markets. To help manage interest rate risk, the portfolio is currently diversified across both short- and intermediate-term bond managers. We believe taking an active approach in our bond exposures provides the ability for allocations to shift across duration, sectors and credit qualities as market conditions evolve.
FOCUSED INCOME STRATEGIES
The Focused Income strategies primarily invest in higher income-generating assets. This can include dividend-paying stocks, option-income strategies, investment-grade bonds, high-yield bonds, emerging markets debt and real estate securities. The strategies’ risk exposure is not tactically managed, which can result in poor performance in weak U.S. market environments. The Focused Income strategies utilize mutual funds and ETFs to construct the strategies.
Performance Review
The Focused Income strategies declined in Q3 as income-generating assets felt pressure from rising interest rates. When bond yields increase, other non-bond income-generating assets often feel the pressure as well and that is what appears to have happened in the quarter. Our strongest performers in the quarter included U.S. and international large cap dividend-oriented strategies, equity option income strategies and our allocation to a multi-asset income manager. The weakest performers in Q3 included closed-end funds, where leverage exacerbated the selloff and discounts to net asset values widened, global real estate income and U.S. mid cap dividend strategies.
Within the Focused Income strategies’ bond allocations, our position in a core intermediate-term bond manager was the weakest performer, as its duration positioning was most impacted when interest rates moved higher during the quarter. Our exposure to tactical bond managers was also weak, as their duration positioning, while underweight relative to core bond benchmarks, still negatively impacted returns. These tactical managers’ positioning helped protect value relative to core intermediate-term bond indices. The performance of our allocation to a short-term, credit-sensitive bond manager was also negative, but the position outperformed the other bond positions due to its lower interest-rate sensitivity.
Our Focused Income – Ultra-Conservative strategy was negative in Q3 as its bond-only portfolio was fully impacted by rising interest rates during the period. All bond manager positions posted negative returns. The strongest relative performers were our allocations to dedicated short-term bond managers, as their limited interest-rate sensitivity was beneficial relative to intermediate-term core bond benchmarks. Our exposure to tactical bond managers and their duration exposure was also a headwind, but their overall positioning helped performance relative to core bond indices. Our exposure to a core intermediate-term bond manager was the weakest performer, as its longer duration relative to our other holdings was a headwind.
Positioning
The Income strategies seek to balance ongoing income generation with long-term capital growth by allocating across multiple income-generating asset classes and investment strategies. To try to provide income diversification, the Income strategies are allocated across global dividend-paying equities, equity option income strategies, global real estate, closed-end funds and credit-sensitive bonds.
In the conservative asset allocation of the Focused Income strategies, generating yield is prioritized through an overweight position in credit-sensitive bonds. We allocate to active short- and intermediate-duration bond managers. We believe their flexible approach has the potential to capture competitive yields while navigating shifting interest rate and credit cycles.
PRESERVE & PARTICIPATE STRATEGIES
The Preserve & Participate strategies take a modern, risk-first approach to portfolio construction. Instead of traditional asset allocation, the strategy uses Q Methodology™ to optimize portfolios based on historical drawdown targets and risk-adjusted return potential. By combining equities, fixed income, and commodities through low-cost ETFs, the models aim to maximize return for each unit of risk taken—aligning with each investor’s unique risk profile.
Performance Review
The Preserve & Participate strategy generated mixed results in Q3, with P&P 45 the best performer and P&P 20 the worst. Similar to Dynamic, the Fed’s decision to raise rates for the first time since 2023 — pushing the 10-year Treasury yield to its highest level in over two decades — weighed on long-duration Treasuries (TLT) and other rate-sensitive exposures across the suite. Extended-duration Treasuries (EDV) fell even further, with core bonds (BND) and long-term bonds (BLV) also pressured. Small-cap and consumer-discretionary equities (IJR; XLY) lagged as well, weighed down by the same higher-borrowing-cost backdrop, alongside real estate (VNQ), which is similarly rate-sensitive.
On the other side, health care (XLV) and communication services (XLC) were the strongest exposures the suite holds, with health care extending a sector rotation that began earlier in the year on strong pipeline news from Eli Lilly and Merck. Gold and physical gold (GLD; PHYS) added further support, benefiting from the same policy uncertainty — a hawkish surprise from a still-new Fed chair and a widening fiscal deficit — that reinforced demand for gold as a hedge even as rates rose. Overall, the model set held up best where allocations leaned into health care and gold, and lagged most where duration and rate-sensitive equity exposure ran highest.
Positioning
P&P 5: Increased short-term Treasuries (SHY, SCHO), health care (XLV), and gold (GLD) while reducing money market exposure, core bonds (BND), and consumer staples (XLP).
P&P 10: Increased core bonds (BND), health care (XLV), technology (XLK), and gold (GLD) while reducing consumer staples (XLP), physical gold (PHYS), and short-term Treasuries (SHY, SCHO).
P&P 20: Increased health care (XLV), physical gold (PHYS), industrials (XLI), consumer discretionary (XLY), gold (GLD), and consumer staples (XLP) while reducing technology (XLK), short-term Treasuries (SHY), extended-duration Treasuries (EDV), communication services (XLC), and long-duration Treasuries (TLT).
P&P 30: Increased small-cap equities (IJR), gold (GLD), and physical gold (PHYS) while reducing technology (XLK), health care (XLV), short-term Treasuries (SHY), consumer staples (XLP), and communication services (XLC).
P&P 45: Increased health care (XLV), consumer discretionary (XLY), technology (XLK), and communication services (XLC) while reducing industrials (XLI), physical gold (PHYS), materials (XLB), and gold (GLD).
P&P 60: Increased physical gold (PHYS), gold (GLD), and industrials (XLI) while reducing consumer discretionary (XLY), technology (XLK), and communication services (XLC).
TOTAL RETURN/TOTAL RETURN ETF STRATEGIES
The Total Return and Total Return ETF strategies provide long-term diversified exposure across U.S. and international equities, bonds and income-generating assets. The strategies are structured to participate in the upside of bullish equity and credit markets and provide moderate income generation. The strategies’ risk exposure is not tactically managed and can result in poor performance in weak market environments. The Total Return strategies utilize mutual funds and ETFs to construct the portfolios, while the Total Return ETF strategies only utilize ETFs to construct the strategies.
Performance Review
The Total Return strategies delivered mixed Q3 results along the risk spectrum. The more aggressive, equity-heavy strategies generated positive returns, while the more conservative, bond-heavy strategies declined in the quarter under the weight of higher interest rates, which pressured the prices of bonds and other interest rate-sensitive asset classes. The strongest performers in the quarter included exposure to the S&P 500 Index, U.S. large cap dividend growth, global value (Total Return only), and international small cap strategies. Our positions in global value and global growth managers (Total Return only) were also positive contributors, while our position in a core global equity manager (Total Return ETF only) was negative in Q3. The weakest performance was driven by exposure to U.S. mid caps, quality large cap international equities, and emerging market equities. Exposure to multi-asset income strategies was mixed, as our allocation to closed-end funds was negative, our tactical multi-asset income mutual fund manager position was slightly positive (Total Return only), and our tactical multi-asset income ETF manager (Total Return ETF only) was slightly negative in the quarter.
In the Total Return and Total Return Muni strategies’ bond allocations, each taxable and municipal bond manager had negative performance in Q3 as interest rates shifted higher during the quarter. The most interest rate-sensitive bond managers experienced the weakest performance in Q3, while the tactical bond managers that were underweight duration and those with less interest rate sensitivity outperformed the others.
Positioning
The Total Return strategies seek growth and income through globally diversified equity and multi-asset income allocations. We blend U.S. and international equities across market cap and investment styles, while generating additional yield through allocations to tactical multi-asset income and closed-end fund strategies. This structure is designed to pursue growth and income across full market cycles.
Our Total Return strategies attempt to diversify across bond markets by combining active core and tactical bond managers. We believe this blend provides the flexibility to manage short-term market shifts while staying anchored to long-term objectives.
U.S. CORE/U.S. CORE ETF STRATEGIES
The U.S. Core and U.S. Core ETF strategies provide long-term exposure to core U.S. equity and bond markets. The strategies may have some exposure to non-core markets, including foreign assets and lower-quality fixed income. The strategies are structured to participate in the upside of bullish U.S. equity and credit markets. The strategies’ risk exposure is not tactically managed and can result in poor performance in weak U.S. market environments. The U.S. Core strategies utilize mutual funds and ETFs to construct the strategies, while the U.S. Core ETF strategies only utilize ETFs to construct the portfolios.
Performance Review
The U.S. Core strategies were mixed in Q3 as dispersion in U.S. equity markets and weakness in bonds drove performance. The more aggressive, equity-heavy strategies were generally flat to positive, while the more conservative, bond-heavy strategies declined in the quarter as higher interest rates pushed bond prices lower. Within equities, the strongest performance was led by positions in large cap value, passive S&P 500 Index, and large cap dividend growth strategies. Negative equity performance was driven by exposure to mid and small cap equities.
The U.S. Core and U.S. Core Muni strategies’ bond allocations were negative in Q3 as interest rates shifted higher, which pushed bond prices lower. All taxable and municipal bond managers posted negative performance in the quarter. Our positions in tactical bond managers were negative, but relatively beneficial, as their underweight duration positioning held up better in the weak bond market environment. Our more interest rate-sensitive bond manager positions were the weakest performers in Q3.
Positioning
The U.S. Core strategies offer exposure to U.S. equities by combining passive market cap-weighted, smart beta factor, and actively managed approaches. The portfolios are structured to provide diversification across market cap and investment styles, with a preference for higher-quality, growing companies to drive long-term capital appreciation.
The U.S. Core strategies provide diversified exposure to U.S. bonds across sectors, credit quality, and duration. We focus our allocations on active bond managers that have the flexibility to deploy capital in the bond markets to take advantage of opportunities and manage risks over the long term.
US CORE X STRATEGY
The U.S. Core X strategy provides long-term exposure to core U.S. equity and bond markets. The strategies may have some exposure to non-core markets, including foreign assets and lower-quality fixed income. The strategies are structured to participate in the upside of bullish U.S. equity and credit markets. The strategy is tactical in nature, allowing for the use of leveraged investments to attempt to generate higher returns. The use of leveraged investments can increase the risk of the strategy. Leveraged investments should be considered speculative investments and may not be suitable for all investors.
Performance Review
The U.S. Core X strategy generated slightly positive returns in Q3, while U.S. equities had mixed performance in the quarter. The strongest performance came from positions in a large cap value manager, leveraged and non-leveraged exposure to the S&P 500 Index, and a quality equity dividend growth manager. The weakest performance was driven by losses across leveraged positions, particularly leveraged small and mid caps, and leveraged Dow Jones Industrial Average exposure. Other negative performers in the quarter included non-leveraged exposure to small caps, mid caps, quality growth stocks, and leveraged exposure to the Nasdaq 100 Index.
Positioning
The U.S. Core X strategy attempts to provide diversified exposure to U.S. equities across market cap and investment styles through passive, factor-based, and actively managed third-party managers. The strategy is also tactically allocated to leveraged equity strategies, providing leveraged exposure to U.S. large, mid, and small cap passive equity indices. No tactical adjustments to leverage were made in Q3, and leveraged exposure remains at a neutral target level. If U.S. equities decline to target price levels, leveraged exposure may be increased at that time.
CONCENTRATED GROWTH SMA STRATEGY
The Concentrated Growth SMA is a focused portfolio of ~40 U.S. large- and mid-cap stocks selected for high returns on invested
capital (ROIC), strong profitability, and reinvestment potential. Using a systematic, quarterly ranking process and a cyclically adjusted
ROE screen, the strategy targets companies with scalable business models and long-term growth prospects. Direct security
ownership helps minimize fees and improve long-term outcomes.
Performance Review
The Concentrated Growth SMA generated negative results in Q3. The strategy’s quarterly rebalance, completed July 29, refreshed roughly 40% of the portfolio, rotating into several of the energy and AI-infrastructure names that went on to lead the quarter, though sharp, concentrated declines elsewhere in the portfolio outweighed those gains.
The largest contributors were Marathon Petroleum and HF Sinclair, as a historic refining margin environment, fueled by Middle East supply disruptions, pushed crack spreads to some of their highest levels on record. Dell Technologies and Nutanix also contributed meaningfully as the AI data-center buildout continued. Dell’s $95 billion backlog in unfilled orders is a sign that customers are ordering new AI servers faster than Dell can build and ship them, suggesting demand for AI computing hardware still has plenty of room to run. That same data-center boom has lifted Nutanix, which supplies storage systems that many of those AI servers rely on. NVIDIA, Medpace, Southern Copper, Fortinet, AngloGold Ashanti, ADP, and Apple were also notable contributors, rounding out a broad list of double-digit gainers.
The primary detractors were Fair Isaac, AppLovin, and NRG Energy. Fair Isaac, the company behind the FICO credit score, declined after federal regulators moved to put its longtime rival, VantageScore, on equal footing in mortgage pricing for the first time, triggering its worst single-day decline since 1989. AppLovin declined on a second-quarter guidance miss and a securities class action over its AI-model disclosures, while NRG Energy fell after missing earnings and absorbing an analyst price-target cut. Overall, strength in energy and AI infrastructure wasn’t enough to offset concentrated, company-specific setbacks elsewhere in the portfolio.
Positioning
AAPL, ALNY, AU, CEG, CHRW, DELL, DINO, EIX, FTNT, MNST, MPC, NBIX, NTNX, OTIS, RDDT
ADBE, APA, CBOE, CDE, COR, DPZ, LLY, MCO, MO, MU, NEM, PEG, PM, PSTG, ROKU
MOAT SMA STRATEGY
The MOAT SMA invests in U.S. large-cap companies with durable competitive advantages, or “economic moats,” such as brand
strength, cost efficiency, or regulatory barriers. Leveraging Morningstar’s moat ratings and fundamental valuation methods, the
strategy seeks to build a risk-aware, long-term growth portfolio focused on capital preservation and consistent outperformance
relative to broad market indices.
Performance Review
The MOAT SMA generated positive results in Q3, helped by a strong rotation into enterprise software and mega-cap technology.
The strongest contributors were Veeva Systems, Microsoft, Meta Platforms, Broadridge, and Estee Lauder. Veeva led the group, after an earnings beat and continued momentum in its Vault CRM migration, with 14 of the top 20 global biopharma companies now committed to the platform. Microsoft also rallied, largely on the back of a single session, the day after its July earnings report showed Azure revenue growth accelerating to the fastest pace in over four years, alongside a sharp rise in AI-related bookings. Beyond these two, a broader market rotation back into enterprise software and mega-cap technology lifted the rest of the group, as fears that AI would disrupt the sector’s business models faded and investors rewarded companies showing durable, AI-linked growth.
The primary detractors were Fair Isaac, Applied Materials, Rollins, TransDigm, and Constellation Brands. These companies lagged in a market environment that favored enterprise software and mega-cap technology over semiconductors, industrials, and other more rate-sensitive exposures. Some of the weakness appears tied to company-specific factors — Fair Isaac, the company behind the FICO credit score, declined after a regulatory decision affecting its core mortgage-scoring business — while part of the underperformance reflects the broader market’s preference for software leadership during the quarter. Overall, the strategy’s exposure to enterprise software and mega-cap technology carried the quarter, while its semiconductor and industrial holdings were the primary drag.
Positioning
Added
ADSK, AMAT, AMZN, AZO, ENTG, GOOGL, LMT, LOW, MPWR, NXPI, ROL, SNPS, TDG, TXN
Removed
NOC
QUALITY DIVIDEND SMA STRATEGY
The Quality Dividend SMA targets financially strong U.S. large-cap companies with a history of stable and growing dividends. Rather
than chasing high yields, the strategy emphasizes balance sheet strength, earnings consistency, and dividend coverage, selecting
the top dividend growers in each sector. This results in a diversified, lower-volatility portfolio built for income and long-term growth.
Performance Review
The Quality Dividend SMA generated negative results in Q3, as weakness in residential-housing-exposed holdings outweighed strength in the portfolio’s financial-data names.
The strongest contributors were Morningstar, SEI Investments, NewMarket, Abbott Laboratories, and Motorola Solutions. Morningstar led the group, as strong second-quarter earnings and growing investor enthusiasm for new AI-linked data partnerships tied to its PitchBook unit lifted the stock. SEI Investments rallied on similar enthusiasm for financial-data and investment-services businesses. Beyond these two, a broader market preference for defensive, cash-generative companies with limited exposure to rising rates lifted the rest of the group.
The primary detractors were Lennox International, Masco, PulteGroup, PPG Industries, and Stryker. Lennox International led the decline, after cutting full-year guidance on weaker-than-expected residential HVAC demand — its worst single-day decline since 2001. Masco and PulteGroup also detracted, both carrying exposure to the same housing and home-improvement end markets that soured following Lennox’s guidance cut. PPG Industries and Stryker rounded out the list of detractors. Overall, weakness in the portfolio’s housing-exposed holdings outweighed strength in its financial-data names, leaving the strategy negative for the quarter.
Positioning
No changes.
SOURCES
- Morningstar Direct. Performance provided as total returns. U.S. Mid Caps is defined by the Russell Mid Cap TR USD index. U.S. Small Caps is defined by the Russell 2000 TR USD index. U.S. Growth is defined by the Russell 3000 Growth TR USD index. U.S. Value is defined by the Russell 3000 Value TR USD index. International Developed is defined by the MSCI EAFE NR USD index. Emerging Markets is defined by the MSCI Emerging Markets NR USD index. U.S. Agg Bond is defined by the Bloomberg U.S. Aggregate Bond TR USD index. U.S. Investment Grade Corp is defined by the Bloomberg U.S. IG Corp USD 300 M TR USD Index. U.S. High Yield is defined by the Bloomberg High Yield Corporate TR USD index. Broad Commodities is defined by the Bloomberg Commodity TR USD index. WTI Crude Oil is defined by the Bloomberg Sub WTI Crude Oil TR USD Index. Gold is defined by the Bloomberg Sub Gold TR USD Index. Industrial Metals is defined by the Bloomberg Sub Industrial Metals TR USD Index. Short-Term Treasuries defined by the Bloomberg 1-3 Yr U.S. Treasury TR USD index. Intermediate-Term Treasuries defined by the Bloomberg Intermediate U.S. Treasury TR USD Index. Long-Term Treasuries defined by the Bloomberg Long-Term U.S. Treasury TR USD Index.
- U.S. Treasury. Daily Treasury Par Yield Curve Rates https://home.treasury.gov/resource-center/data-chart-center/interest-rates/TextView?type=daily_treasury_bill_rates&field_tdr_date_value=2026
- Source: FRED. U.S. Bureau of Economic Analysis, Personal Consumption Expenditures Excluding Food and Energy (Chain-Type Price Index) [PCEPILFE], retrieved from FRED, Federal Reserve Bank of St. Louis; https://fred.stlouisfed.org/series/PCEPILFE, .. U.S. Bureau of Labor Statistics, Unemployment Rate [UNRATE], retrieved from FRED, Federal Reserve Bank of St. Louis; https://fred.stlouisfed.org/series/UNRATE, .
- CME Group. FedWatch Tool. Retrieved 10/3/26 fromhttps://www.cmegroup.com/markets/interest-rates/cme-fedwatch-tool.html
- U.S. Bureau of Labor Statistics. Producer Price Index for Final Demand Components. September 16, 2026. Retrieved from https://www.bls.gov/opub/ted/2026/producer-price-index-up-5-4-percent-for-the-12-months-ended-august-2026.htm
- American Staffing Association. GDP Quarterly. Retrieved from https://americanstaffing.net/research/asa-data-dashboard/gdp-quarterly-projections/
- Institute for Supply Management. September Manufacturing and Services PMIs. https://www.ismworld.org/supply-management-news-and-reports/reports/ism-pmi-reports/services/september/
- FactSet. Earnings Insight. 9/28/26
- FactSet. S&P 500 Index Forward 12-Month Price-to-Earnings Ratio. 9/30/26.
- TradingView.com. 10-Year Treasury Yield. 30-Year Treasury Yield. As of 10/8/26.
- U.S. Energy Information Administration, US Regular Conventional Gas Price [GASREGCOVW], retrieved from FRED, Federal Reserve Bank of St. Louis; https://fred.stlouisfed.org/series/GASREGCOVW, . U.S. Energy Information Administration, US Diesel Sales Price [GASDESW], retrieved from FRED, Federal Reserve Bank of St. Louis; https://fred.stlouisfed.org/series/GASDESW, .
- TradingView.com. WTI Crude Oil. Retrieved from https://www.tradingview.com/chart/S5oI8Odc/?symbol=TVC%3AUSOIL
- TradingView.com. Gold. Retrieved from https://www.tradingview.com/chart/S5oI8Odc/?symbol=TVC%3AGOLD
IMPORTANT DISCLOSURES
The opinions voiced in this material are for general information only and are not intended to provide or be construed as providing specific investment advice or recommendations for any individual security.
Any economic forecasts set forth in the presentation may not develop as predicted and there can be no guarantee that strategies promoted will be successful.
The term “portfolios” used in this piece is in reference to the Intrua Financial model portfolios. Any reference to performance is based on estimated, unaudited, gross of fee performance of the model portfolios. Model portfolio performance is calculated through Morningstar Direct based on model portfolio holdings. Client accounts assigned a Intrua Financial model portfolio may have positioning and performance that differs from the firm’s model portfolios at any given time.
There is no assurance that the techniques and strategies discussed are suitable for all investors or will yield positive outcomes. The purchase of certain securities may be required to affect some of the strategies. Investing in stocks includes numerous specific risks including: the fluctuation of dividend, loss of principal and potential illiquidity of the investment in a falling market.
Bonds are subject to market and interest rate risk if sold prior to maturity. Bond and bond mutual fund values and yields will decline as interest rates rise and bonds are subject to availability and change in price. Government bonds and Treasury bills are guaranteed by the U.S. government as to the timely payment of principal and interest and, if held to maturity, offer a fixed rate of return and fixed principal value. However, the value of fund shares is not guaranteed and will fluctuate.
Investing in stock includes numerous specific risks including: the fluctuation of dividend, loss of principal, and potential illiquidity of the investment in a falling market.
Asset management does not ensure a profit or protect against loss. There is no guarantee that a diversified portfolio will enhance overall returns or outperform a non-diversified portfolio. Diversification does not protect against market risk.
The fast price swings in commodities will result in significant volatility in an investor’s holdings. Commodities include increased risks, such as political, economic, and currency instability, and may not be suitable for all investors.
Precious metal investing involves greater fluctuation and the potential for losses.
Alternative investments may not be suitable for all investors and should be considered as an investment for the risk capital portion of the investor’s portfolio. The strategies employed in the management of alternative investments may accelerate the velocity of potential losses.
International investing involves special risks such as currency fluctuation and political instability and may not be suitable for all investors. These risks are often heightened for investments in emerging markets.
Intrua Financial, LLC (“Intrua”) is an SEC-registered investment adviser. Registration as an investment adviser does not imply a certain level of skill or training.
This research material has been prepared by Intrua Financial, LLC.